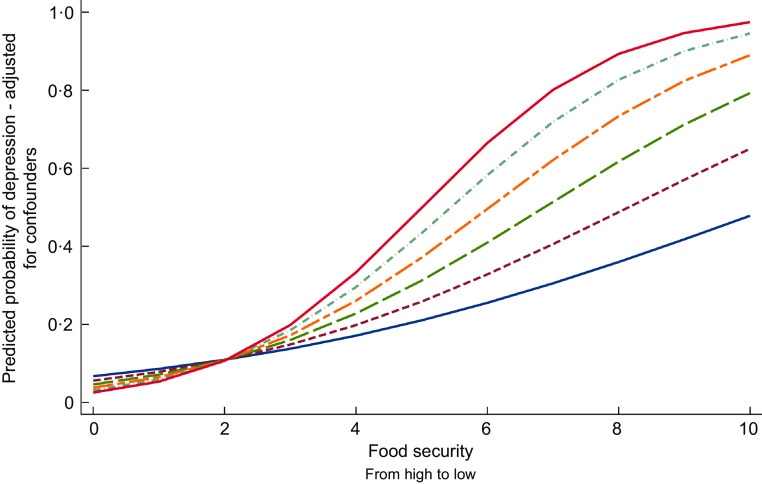
Fig. 2.
The moderating effect of food diversity in the association between food security and depression: plotting the predicted probabilities.  0·5;
0·5;  0·6;
0·6;  0·7;
0·7;  0·8;
0·8;  0·9;
0·9;  1
1
Source: Centers for Disease Control and Prevention (CDC). NationalCenter for Health Statistics (NCHS). 2013–2014-National Health and Nutrition Examination Survey Data. Hyattsville, MD: US Department of Health and Human Services, Centers for Disease Control and Prevention. FPED: 2013–2014 Food Patterns Equivalents Database. US Department of Agriculture. Note: This graph depicts the predicted probabilities obtained from calculating the marginal effects from Model 4. The estimate of the interaction was statistically significant P < 0·001.

