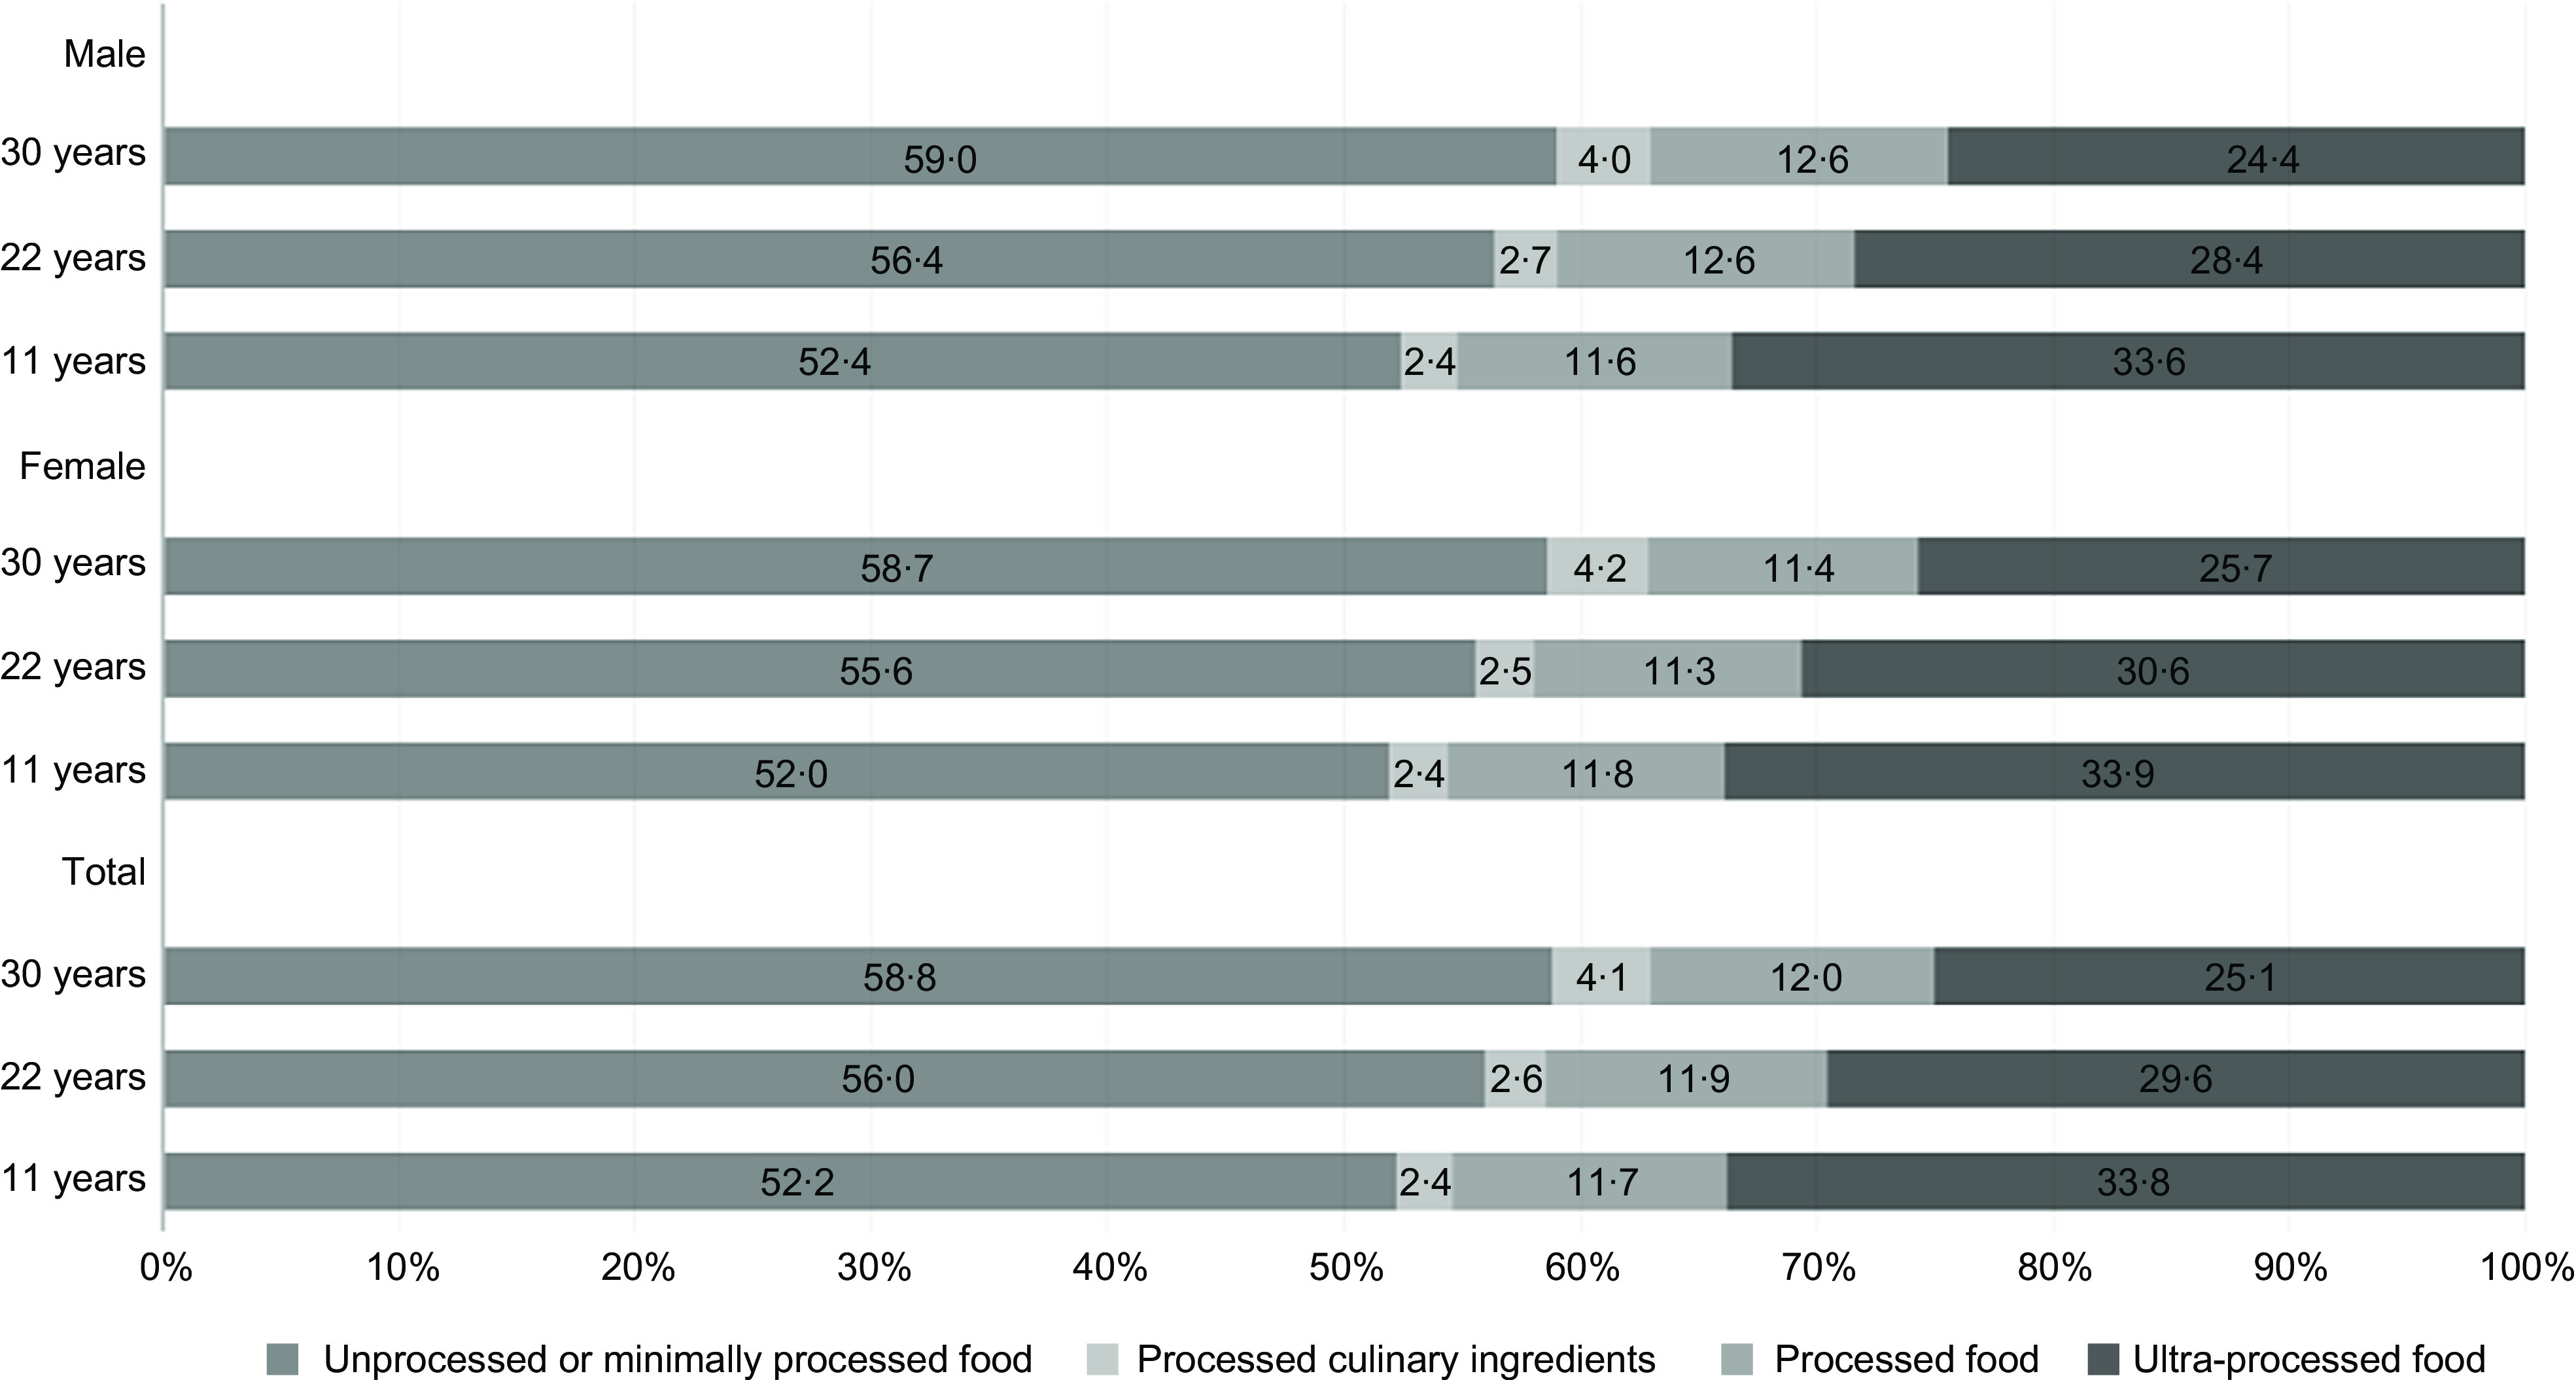
Fig. 1.

Mean energy contribution (%) from each food processing group at 11, 22 and 30 years, respectively, in the 2004, 1993 and 1982 Pelotas Birth Cohorts, adjusted for perinatal (monthly family income and maternal age, schooling and skin color) and current characteristics (sex, skin colour, schooling, monthly family income, diet for weight loss and energy intake/energy expenditure ratio)
