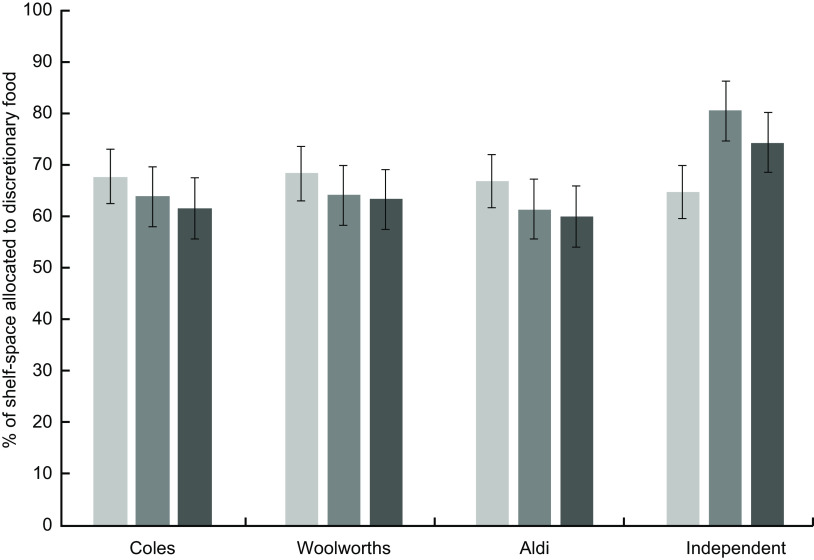
Fig. 1.
Mean proportion of shelf space of key categories of discretionary food as a proportion of the combined shelf space of key categories of discretionary and healthy food*, by supermarket group and area-level socio-economic position (SEP)†. Figure depicts results of linear regression models that included supermarket group, SEP and interaction of supermarket group by SEP. *Discretionary food refers to chocolate, confectionery, sweet biscuits, chips, soft drinks and energy drinks; healthy food refers to fresh and frozen fruit and vegetables. †SEP based on quintiles of Australian Bureau of Statistics Index of Relative Socio-economic Advantage and Disadvantage (IRSAD)

