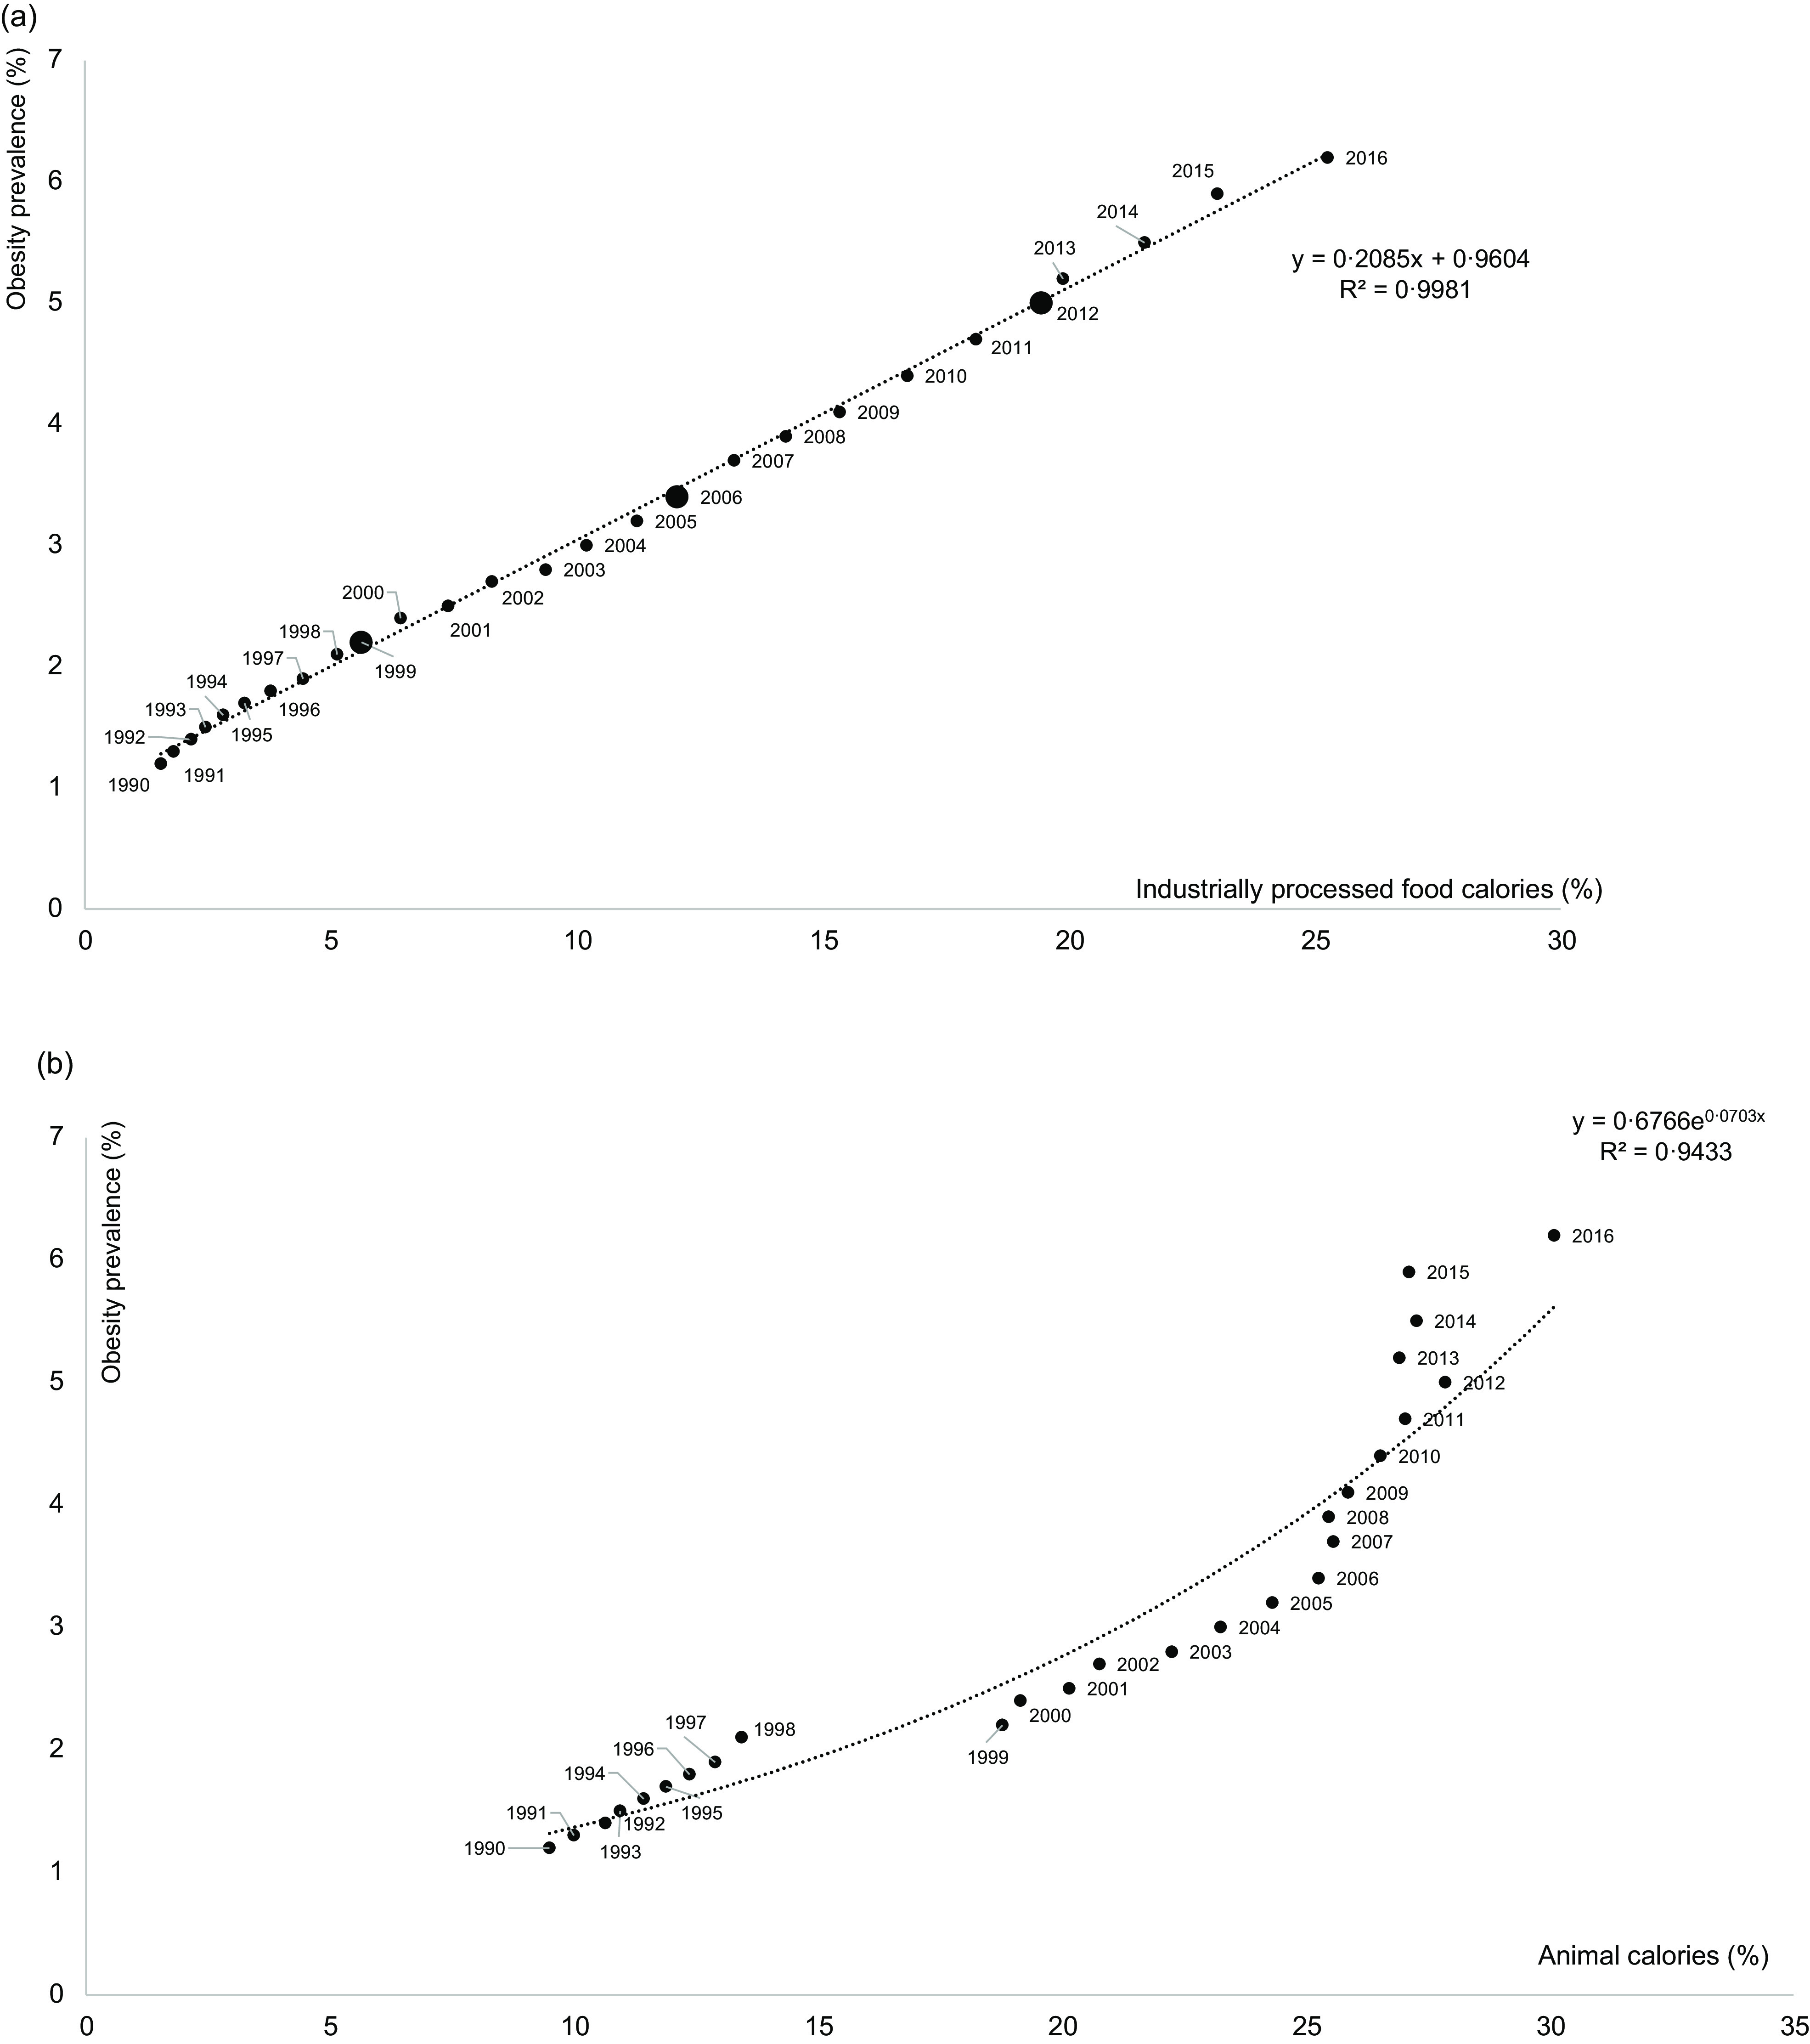
Fig. 8.

During the 1990–2016 period: percentages of: (a) industrially processed food calorie share; and (b) animal calorie shares and the prevalence of obesity (%) (larger circles are real data in 1999, 2006 and 2012 for IPF, and small triangles are extrapolated data). Fitted curves were chosen based on the highest R 2
