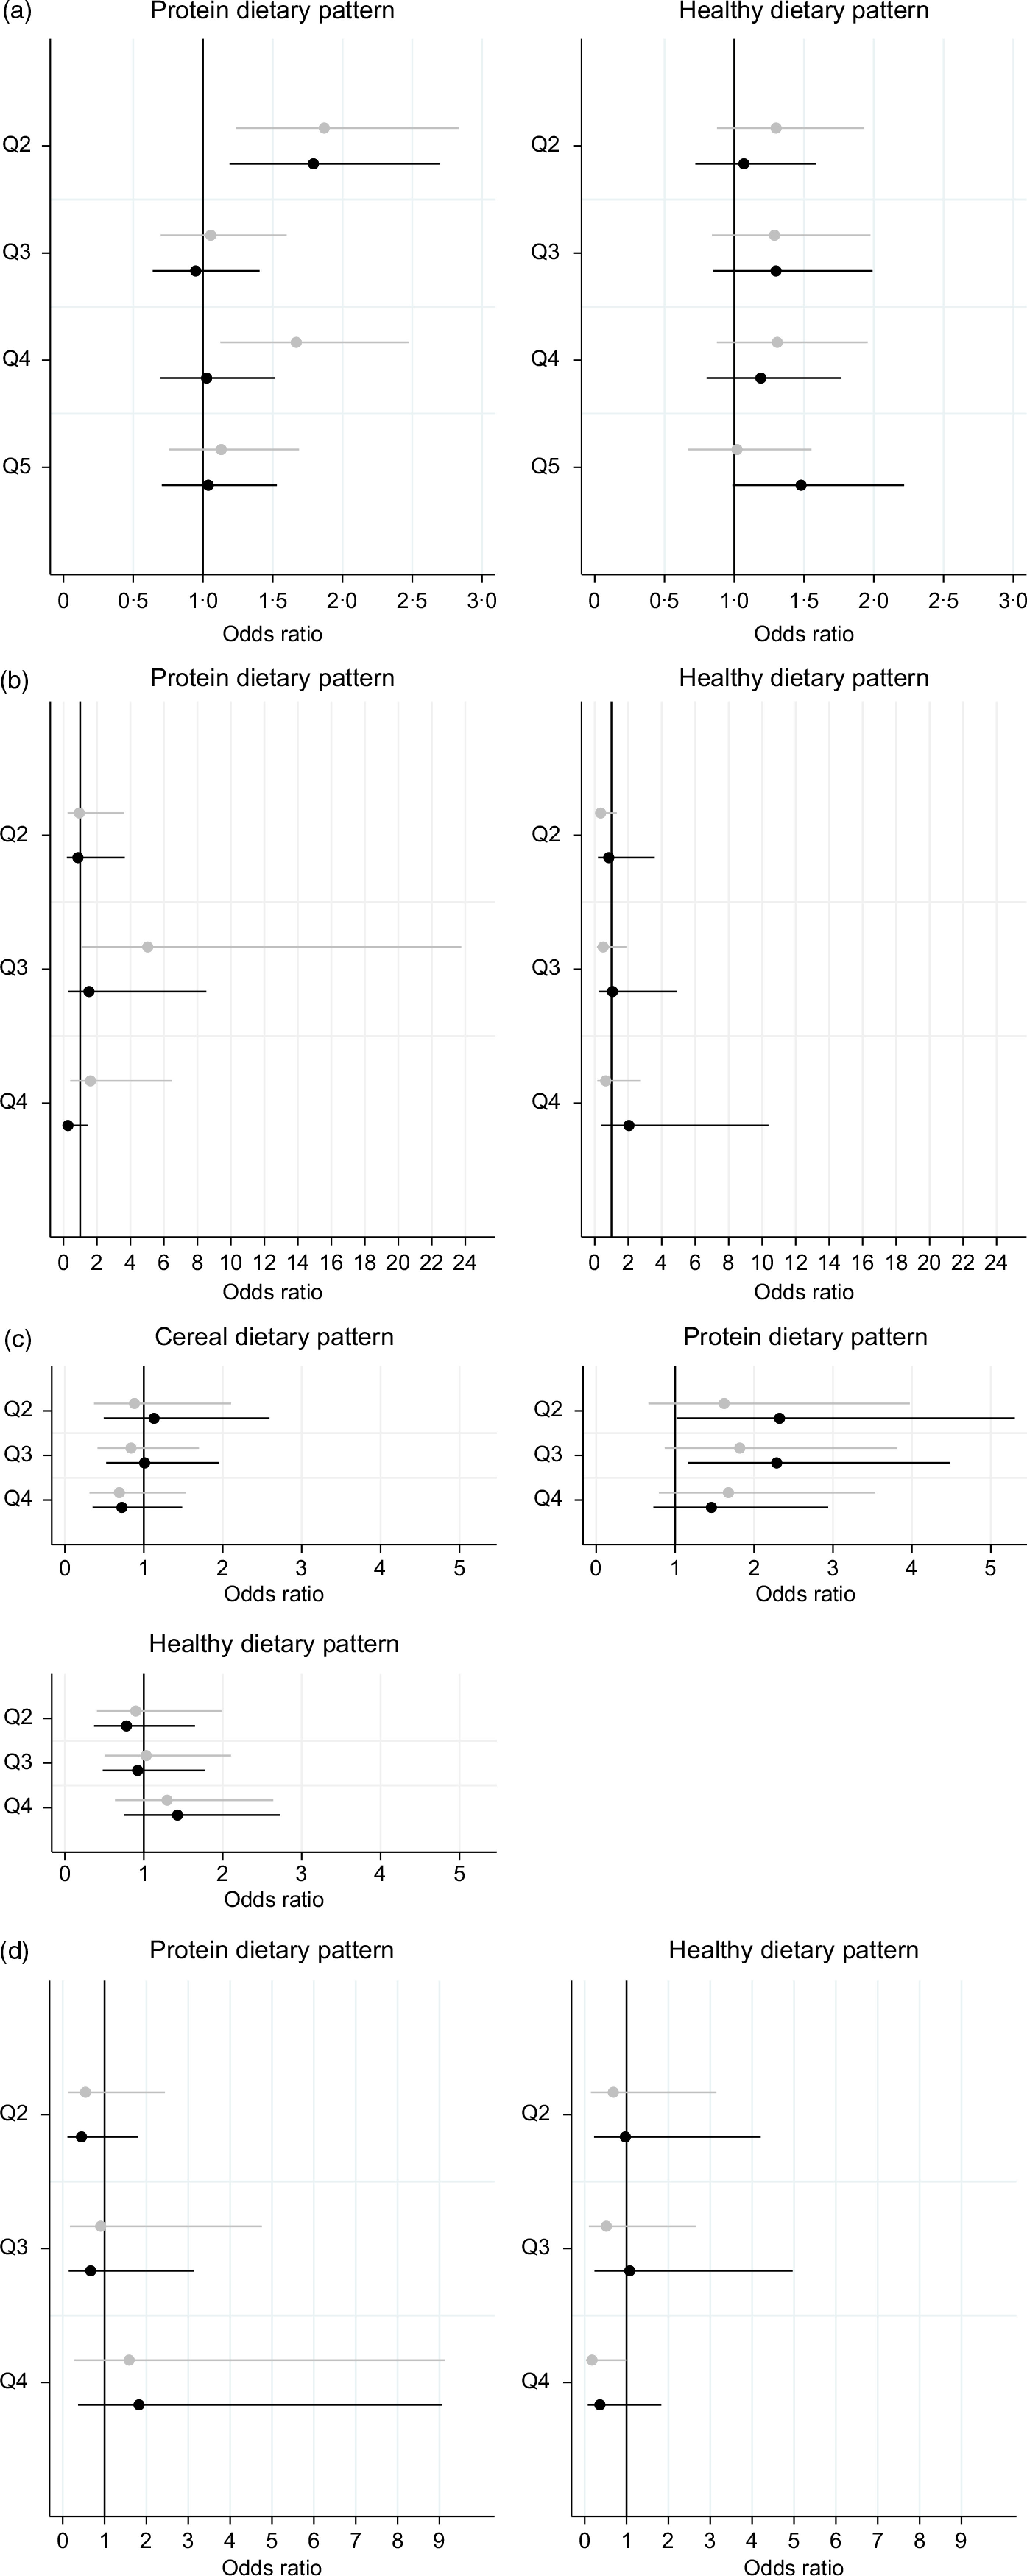
Fig. 1.

(a) Association between principal component analysis-derived dietary patterns and overweight and obesity among women of reproductive age (18–54 years) in Ghana. Estimates from a multinomial logistic model controlling for age, education, marital status and wealth. For each dietary pattern, comparisons were to quintile 1 (Q1). Overweight was defined as BMI ≥ 25 kg/m2 and BMI < 30 kg/m2 and obesity as BMI ≥ 30 kg/m2. Comparison was to women of normal weight (BMI ≥ 18·5 kg/m2 and BMI < 25 kg/m2). (b) Association between principal component analysis-derived dietary patterns and overweight and obesity among women of reproductive age (19–48 years) in Malawi. Estimates from a multinomial logistic model controlling for age, education and wealth. For each dietary pattern, comparisons were to quartile 1 (Q1). Overweight was defined as BMI ≥ 25 kg/m2 and BMI < 30 kg/m2 and obesity as BMI ≥ 30 kg/m2. Comparison was to women of normal weight (BMI ≥ 18·5 kg/m2 and BMI < 25 kg/m2). (c) Association between principal component analysis-derived dietary patterns and overweight and obesity among older women (≥55 years) in Ghana. Estimates from a multinomial logistic model controlling for age, education and wealth. For each dietary pattern, comparisons were to quartile 1 (Q1). Overweight was defined as BMI ≥ 25 kg/m2 and BMI < 30 kg/m2 and obesity as BMI ≥ 30 kg/m2. Comparison was to women of normal weight (BMI ≥ 18·5 kg/m2 and BMI < 25 kg/m2). (d) Association between principal component analysis-derived dietary patterns and overweight and obesity among older women (≥50 years) in Tanzania. Estimates from a multinomial logistic model controlling for age, marital status and wealth. For each dietary pattern, comparisons were to quintile 1 (Q1). Overweight was defined as BMI ≥ 25 kg/m2 and BMI < 30 kg/m2 and obesity as BMI ≥ 30 kg/m2. Comparison was to women of normal weight (BMI ≥ 18·5 kg/m2 and BMI < 25 kg/m2).  , overweight and
  , obesity
