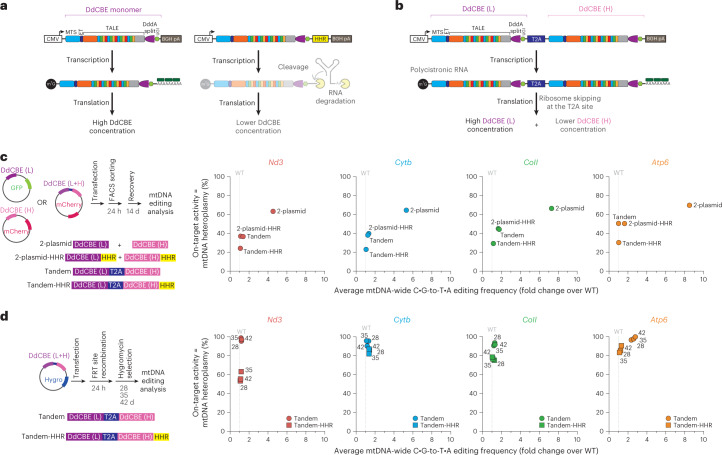
Fig. 5. Optimization of MitoKO constructs by limiting off-target mutagenesis.
a, Schematic of MitoKO transgene (DdCBE monomer) without (left) or with the HHR incorporated (right). After transcription, the mRNA encoding DdCBE is constitutively degraded following HHR cleavage, resulting in substantially lower quantities of translated protein. ET, epitope tag; BGH pA, bovine growth hormone polyadenylation signal. Other symbols/abbreviations as in (Fig. 1a.) or defined in text. b, Schematic of MitoKO transgenes (DdCBE (L) and DdCBE (H)) linked by the T2A ribosome skipping sequence. Expression of the DdCBE in the tandem T2A-linked arrangements leads to lower concentrations of the downstream monomer in the mitochondrial matrix. c, Left: schematic of the general workflow for the on/off-target optimization experiments, involving transient transfection of NIH/3T3 cells with plasmids co-expressing DdCBE monomers and fluorescent marker proteins, FACS-based selection of cells expressing both monomers, recovery and phenotypic evaluation of DdCBE-treated cells (top). Schematic representation of the DdCBE arrangements used (bottom). Right: on-target (Y axis) and off-target (X axis) performance of the Nd3, Cytb, CoII and Atp6 MitoKO constructs transiently delivered into NIH/3T3 cells as separate monomers (2-plasmid), separate monomers with the HHR incorporated in mRNA (2-plasmid-HHR), bi-cistronic construct with the tandemly arrayed DdCBE monomers being linked by the T2A element (Tandem) and the tandem T2A-linked monomers harbouring HHR (Tandem-HHR). Dots represent the mean (n = 3 biological replicates). Source data are provided as a Source Data file. d, Left: schematic of the workflow of the on/off-target optimization experiments for stably expressed tandem constructs without (Tandem) or with HHR (Tandem-HHR), involving transfection, recombination into a docking nuclear DNA site and hygromycin selection (top). Schematic representation of the DdCBE arrangements used (bottom). Right: on-target (Y axis) and off-target (X axis) performance of the Nd3, Cytb, CoII and Atp6 Tandem and Tandem-HHR MitoKO constructs stably expressed in NIH/3T3 cells. Dots represent the mean (n = 3 biological replicates).

