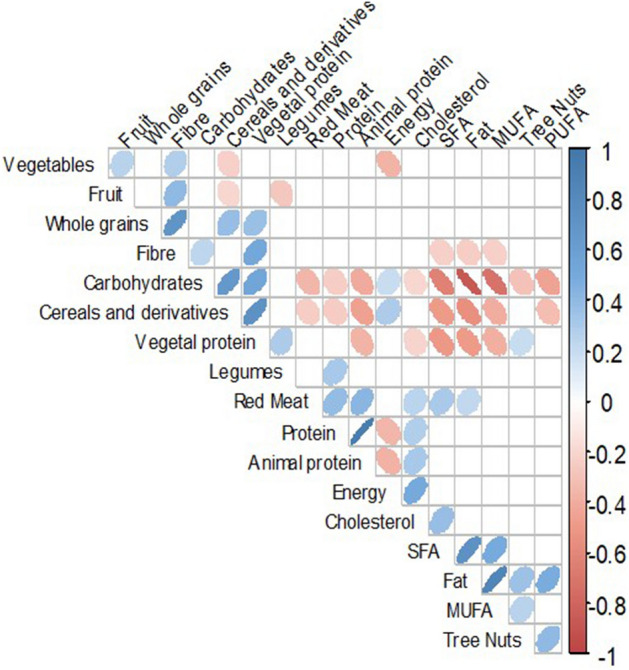
Fig. 3.

Correlogram of the upper triangular of the correlation matrix of the change in energy, nutrients, and food consumption (adjusted by energy) of 177 individuals from the CORDIOPREV (coronary diet intervention with olive oil and cardiovascular prevention) study after receiving dietary counselling. Figure shows correlations which p values were < 0.01. Positive correlations are displayed in blue and negative correlations in red, and colour intensity is proportional to the correlation coefficient. The ellipses have their eccentricity parametrically scaled to the correlation value. SFA saturated fatty acids, MUFA monounsaturated fatty acids, and PUFA polyunsaturated fatty acids
