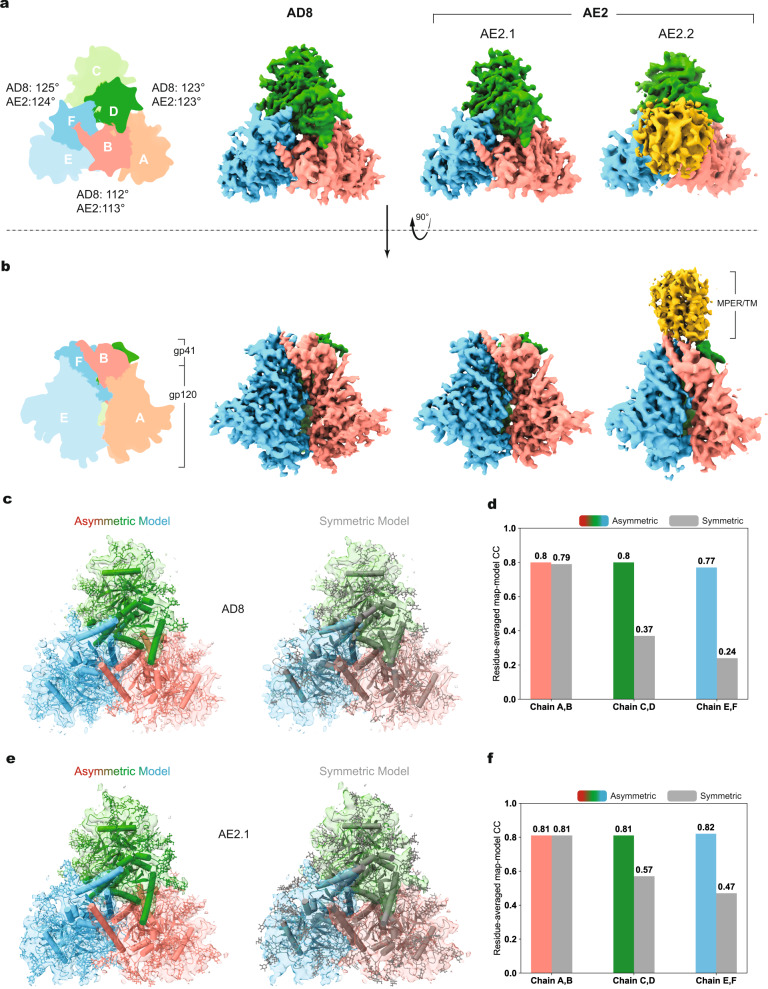
Fig. 1. Asymmetric structures of the AD8 and AE2 Env trimers.
a Views of the AD8, AE2.1, and AE2.2 Env density maps along the trimer axis, from the perspective of the expressing cell/viral membrane. The individual protomers of the Env trimers are colored blue, green, and coral red. The schematic diagram on the left indicates the designations of the gp120 (a, c, and e) and gp41 (b, d, and f) chains and color scheme that will be used throughout the rest of the manuscript. The opening angles of each of the interprotomer interfaces in the AD8 and AE2.1 Env trimers are shown. The density associated with the gp41 membrane-proximal external regions (MPERs) and transmembrane (TM) regions in the AE2.2 map is colored yellow. b Side views of the AD8, AE2.1, and AE2.2 Env density maps, with the gp41 subunits at the top and the gp120 subunits at the bottom of the images. c, e The density maps of the AD8 (c) or AE2.1 (e) Envs fitted with asymmetric trimer models (left) or pseudo-C3 symmetric models (right) are shown. The structures of the Env protomers in the pseudo-C3 symmetric model are identical to those in the asymmetric model, except that the rotational angles between each pair of protomers was set to 120°. The pseudo-C3 symmetric models were fitted into the density of one protomer (Chains A and B). For all models, only the first mannose residue on each glycan is shown. d, f Map-model correlation coefficients (CC) for the symmetric and asymmetric models were calculated for each protomer of the AD8 (d) or AE2.1 (f) Env. The colors of the bars for the asymmetric models correspond to the colors of the chains in the maps and models. The overall residue CC (without glycans) was calculated for each protomer; the CC value shown is the average of the CC values of the three protomers.

