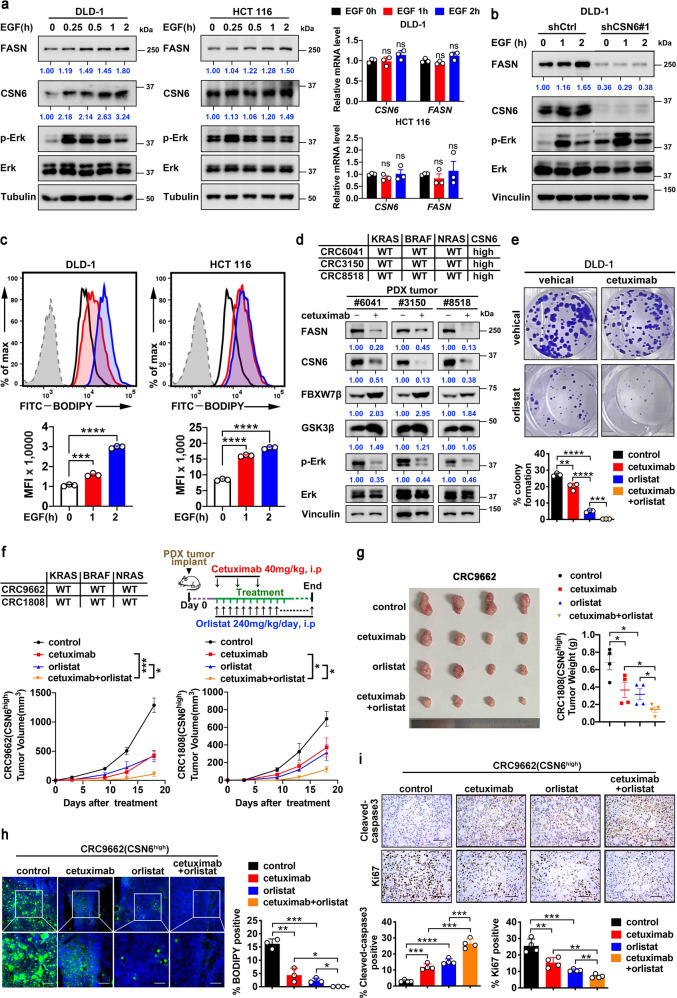
Fig. 8.
Combination treatment of cetuximab and orlistat suppressed CSN6-high CRC PDX model tumor growth with better efficacy. a DLD-1 and HCT 116 cells were serum-starved overnight and treated with EGF (100 ng/mL) for the indicated time. Cell lysates were immunoblotted with the indicated antibodies (left). qRT-PCR analysis was performed to measure the mRNA expression of indicated genes (right). b DLD-1 cells infected with control shRNA or CSN6 shRNA were treated with EGF (100 ng/mL) for the indicated time. Cell lysates were immunoblotted with the indicated antibodies. c Flow cytometry analysis of BODIPY-stained DLD-1 and HCT 116 cells treated with EGF (100 ng/mL) for the indicated time. Representative histograms and mean fluorescence intensities (MFI) were shown. d Gene status of CRC PDXs is indicated (top). Western blot analysis of indicated proteins in PDX tumors with or without cetuximab treatment (bottom). e Colony-formation assays generated from DLD-1 cells treated with cetuximab and/or orlistat are indicated. f Gene status of CRC PDXs and treatment schedule of cetuximab and/or orlistat are indicated (top). The growth curve of indicated PDX tumors in mice was measured (bottom). g The resulting tumors generated in f were resected and photographed at the end of the experiment (top). Tumor weight of each group was measured (bottom). h Fluorescence microscopy analysis of frozen sections from indicated PDX tumors stained with BODIPY 493/503 dye (green) and DAPI (blue). Representative images (left) and fluorescent BODIPY quantification (right) of indicated groups were shown. Scale bar, 20 μm. i Representative IHC images of cleaved-caspase 3 and Ki67 staining in indicated PDX tumors (top). Scale bars, 50 μm. Quantification of the percentage of Cleaved-caspase 3 and Ki67 positive cells of indicated groups was shown (bottom). All values are expressed as means ± SD. ns, not significant, *P < 0.05, **P < 0.01, ***P < 0.001, ****P < 0.0001; as determined by two-way ANOVA (f) or by one-way ANOVA (a, c, e, g–i)

