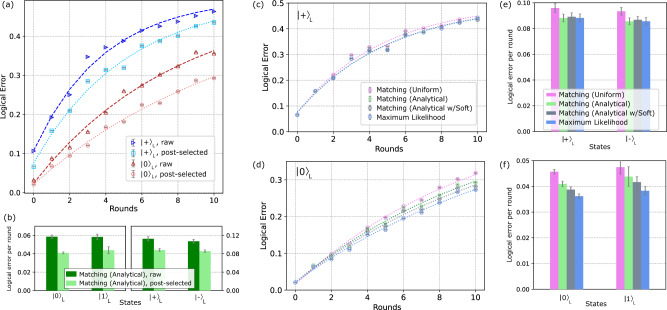
Fig. 2. Logical error results.
a Logical error versus number of syndrome measurement rounds r, where one round includes both a Z and an X stabilizer measurement. Blue right-pointing triangles (red triangles) mark logical errors obtained from using matching analytical decoding on raw experimental data for () states. Light blue squares (light red circles) mark those for () with the same decoding method but using leakage-post-selected experimental data. Error bars denote sampling error of each run (500,000 shots for raw data, variable number of shots for post-selected). Dashed line fits of error yield error per round plotted in b. b Applying the same decoding method on leakage-post-selected data, shows substantial reduction in overall error for all four logical states. See Methods “Post-selection method” for details on post-selection. Fitted rejection rate per round for , , , are 4.91%, 4.64%, 4.37%, and 4.89%, respectively. Error bars denote one standard deviation on the fitted rate. c, d Using post-selected data, we compare logical error obtained with the four decoders: matching uniform (pink circles), matching analytical (green circles), matching analytical with soft information (gray circles), and maximum likelihood (blue circles). (See Fig. 6 for and ). Dashed fitted rates presented in e, f. Error bars denote sampling error. e, f Comparison of fitted error per round for all four logical states using matching uniform (pink), matching analytical (green), matching analytical with soft information (gray), and maximum likelihood (blue) decoders on leakage-post-selected data. Error bars represent one standard deviation on the fitted rate.

