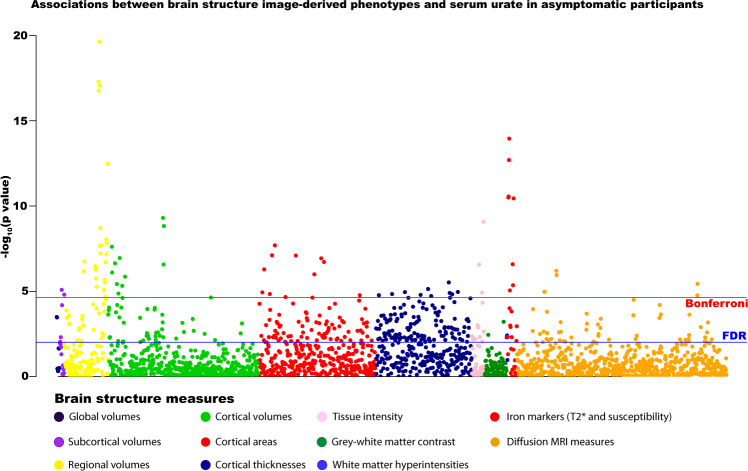
Fig. 1. Associations between serum urate and brain structure measures in asymptomatic participants (n = 33,367).
Multiple linear regression models adjusted for: all image-related confounds, age, age2, sex, educational qualifications, Townsend Deprivation Index, household income, historical job code, waist-hip-ratio, alcohol intake, smoking status, diuretic use. Multiple comparison correction: blue line represents False Discovery Rate (FDR) two-sided P value threshold (5%) = 9.58 × 10⁻³, red line represents Bonferroni threshold on 2138 tests = 2.34 × 10⁻⁵). Source data are provided as a Source Data file.

