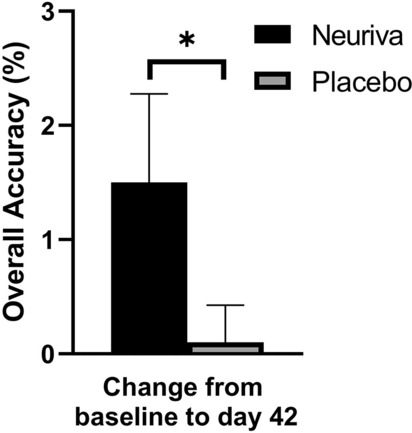
Fig. 4.

Picture recognition change in scores for overall accuracy (%; p = 0.035) from baseline at day 42 for Neuriva® and placebo in the PP population (n = 128). Memory, accuracy, and learning were assessed by overall accuracy by the picture recognition task. All values presented are mean ± SEM. Between group changes were compared using a two-sample t test with p < 0.05 considered statistically significant. Asterisk indicates a statistically significant difference between Neuriva® and placebo
