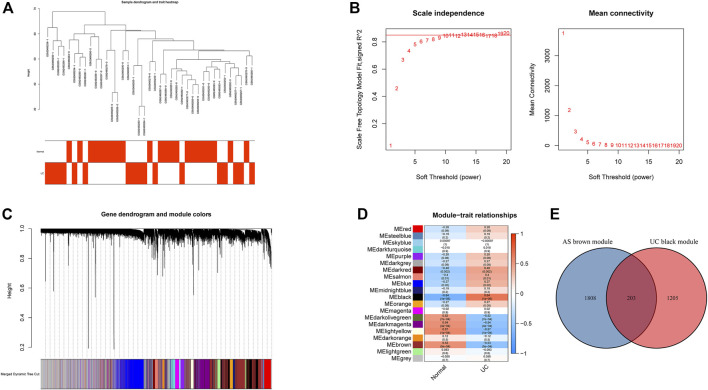
FIGURE 2.
Construction of weighted gene co-expression networks in GSE94648. (A) Clustering dendrogram of samples. (B) Network topology analysis of different soft threshold power. (C) Dendrogram of the gene modules. (D) The correlation coefficients between gene modules and UC occurrence. (E) Venn diagram of AS-related genes and UC-related genes.

