FIGURE 1.

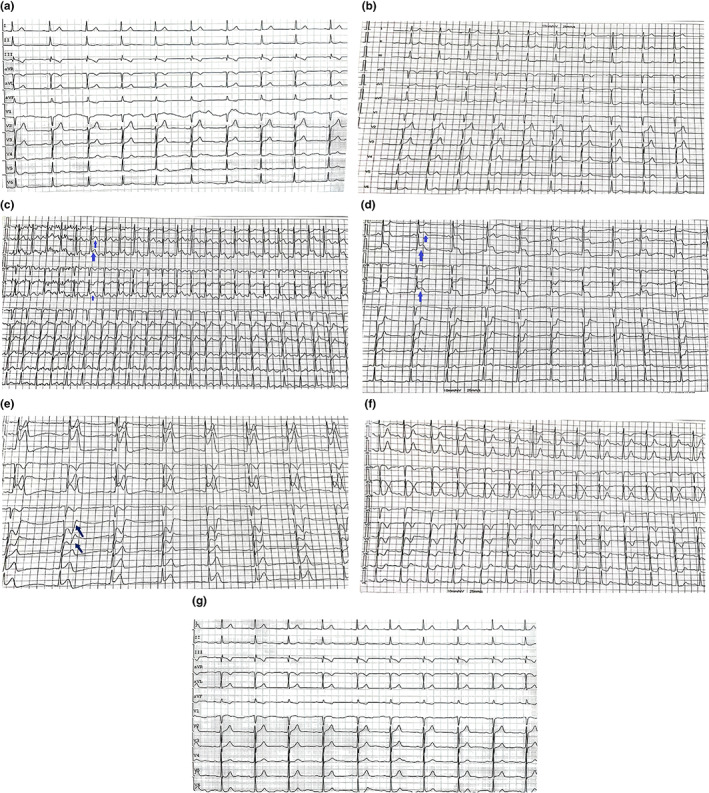
ECG. (a) Standard 12‐lead surface ECG of the patient upon admission. Sinus bradycardia, T wave changes. (b) The ECG of the beginning of the treadmill test. No obvious abnormality was found in each lead. (c) Start exercising under load. ST‐segment elevation in II, III, and avF leads (arrow). (d) Almost reaching maximum load exercise. ST‐segment elevation was more obvious in II, III, and avF leads (arrow). (e) Gradually reducing the load and exercise. ST‐segment continued to change (arrow). (f) The ECG of the treadmill test that is about to stop. ST segment changes also gradually recovered. (g) Standard 12‐lead surface ECG after operation. Sinus heart rate, and roughly normal ECG.
