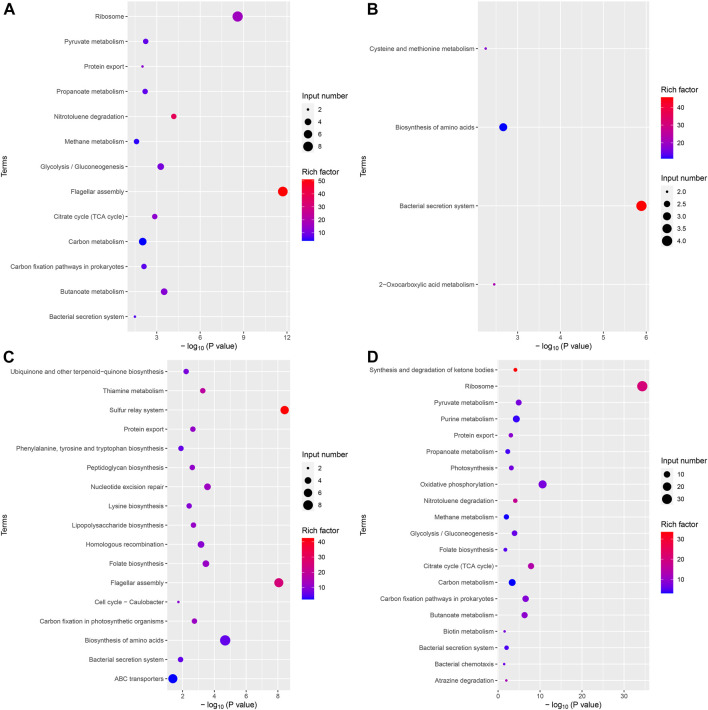
FIGURE 6.
Bubble plot of differentially expressed genes KEGG analysis. The horizontal axis represented the significance of enrichment with -log10 (p-value); the larger the value, the more significant the enrichment, and the vertical axis represented the KEGG pathway. The size of the dots indicated the number of differential genes contained in the KEGG pathway, and the depth of the dots indicated the degree of enrichment. (A) Upregulated differential gene set in VPZ and control groups. (B) Downregulated differential gene set in VPZ and control groups. (C) Upregulated differential gene set in EPZ and control groups. (D) Downregulated differential gene set in EPZ and control groups.

