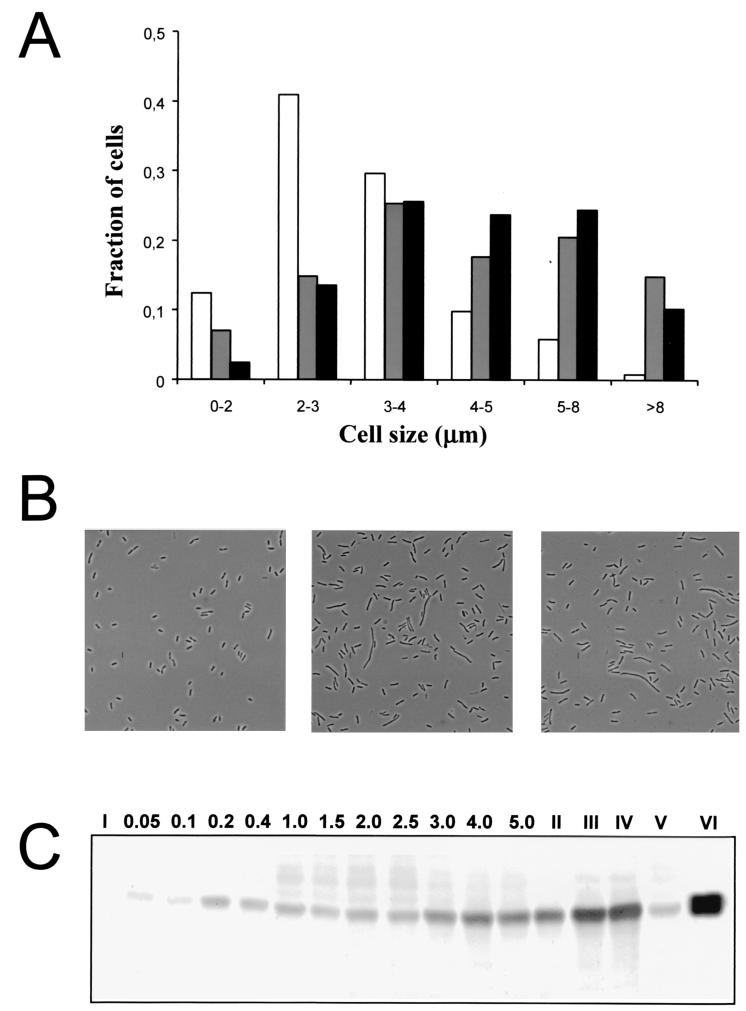
FIG. 5.
Cell size and flagellar content in liquid cultures and a population isolated from the edge of a swarming colony. (A) Cell size distributions of an S. liquefaciens MG1 population from a mid-log-phase (OD450 = 0.4) culture (white bars), an S. liquefaciens MG1 population from the edge of a swarming colony (gray bars), and an S. liquefaciens MG3/pMG600 population from an IPTG-induced (1 mM) mid-log-phase culture (black bars). (B) Micrographs of MG1 cells from a mid-log-phase culture (left), MG1 cells from the edge of a swarming colony (middle), and MG3/pMG600 cells from an IPTG-induced (1 mM) mid-log-phase culture (right). (C) Western blot with flagellum-specific antibodies. Lane I, MG3 (flhD); lanes II, III, and IV, samples from the edge of a swarming MG1 colony loaded 3-fold diluted, 1.5-fold diluted, and undiluted, respectively; lane V, sample from the center of a swarming MG1 colony; lane VI, sample from an IPTG-induced (1 mM) MG3/pMG600 mid-log-phase culture; lanes 0.05 to 5.0, samples from an exponentially growing MG1 culture at OD450 values equal to the lane numbers.

