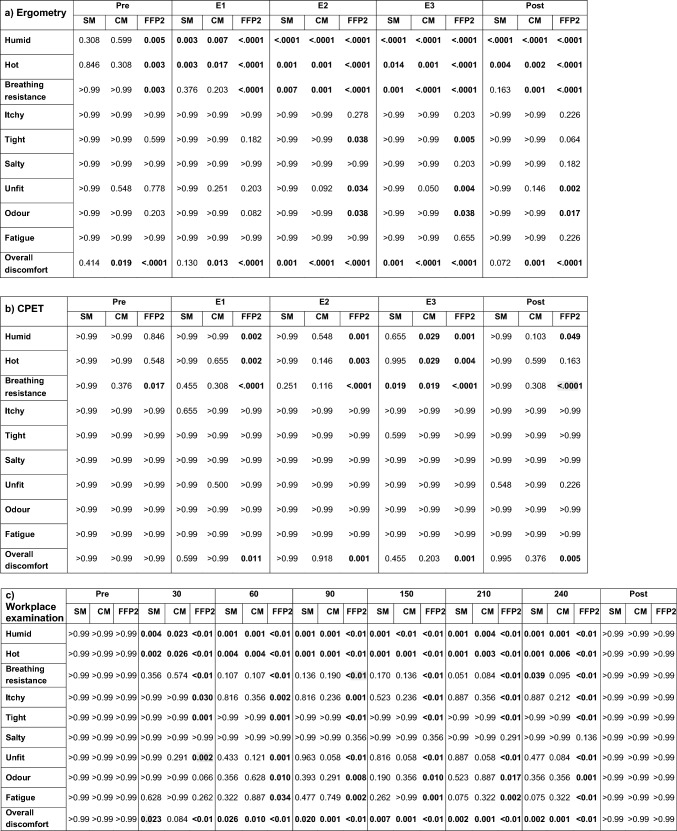
Table 2.
Results of statistical analysis of the data from Comfort Score questionnaire in 40 subjects during ergometry (a), CPET (b) and workplace examination (c).
For each load level (pre, E1, E2, E3, post) or time of measurement (pre, 30–240 min., post), the data with mask (SM, CM, FFP2) were compared with the respective non-mask situation (NM) using Dunn’s multiple comparisons test after Friedman test. Shown are p values (< 0.05 marked bold).
NM no mask, SM surgical mask, CM community mask, FFP2 filtering face piece class 2, CPET Cardiopulmonary exercise test.
The load levels in ergometry and CPET corresponded to light work (pre and post), moderate (E1), heavy (E2) and very heavy work (E3).
In Table (c): < 0.01 means < 0.0001.

