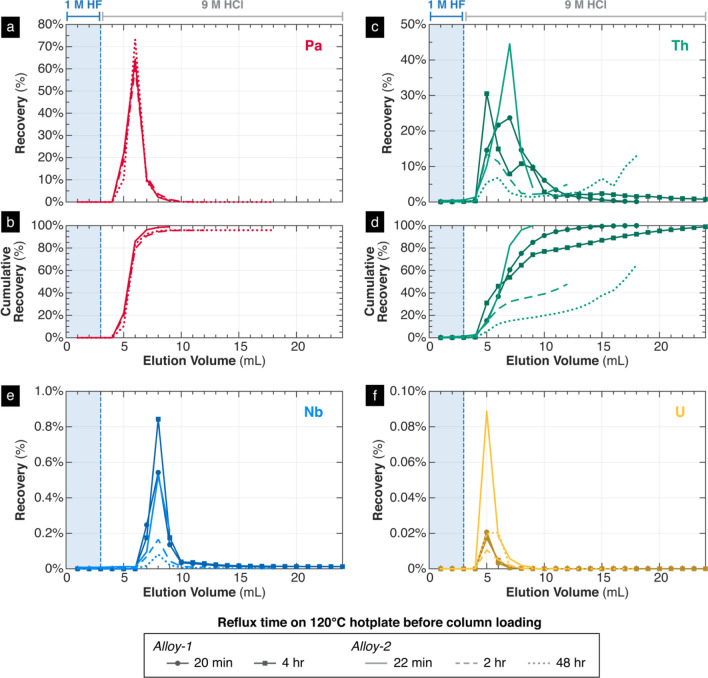
Fig. 8.
Elution profiles of Pa (a, b), Th (c, d), Nb (e), and U (f) from five column separation experiments on Alloy-1 and Alloy-2, plotted as the cumulative volume of eluted acid versus the recovery of each element within each eluted fraction. All sample loads, sequence of acid eluents, and experimental conditions across the five tests were kept constant, varying only the sample used and the amount of time that the sample was refluxed on a 120 °C hotplate before column loading (see legend). Pa recovery was only measured for three experiments using Alloy-2

