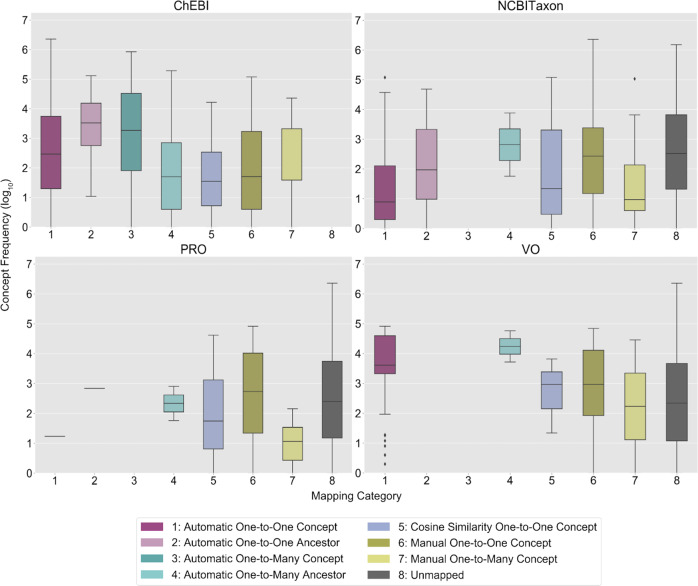
Fig. 5. Drug ingredient concept frequency of use in clinical practice by mapping category and ontology.
This figure presents the frequency distributions of OMOP (Observational Medical Outcomes Partnership) drug exposure ingredient concepts used at least once in clinical practice (log 10 scale) in the Children’s Hospital Colorado pediatric OMOP database by mapping category and OBO (Open Biological and Biomedical Ontology) Foundry ontology. In each boxplot, the box extends from the first to third quartile of the data with a center line used to indicate the median. Whiskers extend from each box by 1.5x the interquartile range and outliers that extend past the whiskers shown as dots. The x-axis labels are numbers which correspond to the OMOP2OBO mapping categories: (1) Automatic One-to-One Concept; (2) Automatic One-to-One Ancestor (3) Automatic One-to-Many Concept; (4) Automatic One-to-Many Ancestor; (5) Cosine Similarity One-to-One Concept; (6) Manual One-to-One Concept; (7) Manual One-to-Many Concept; and (8) Unmapped. ChEBI Chemical Entities of Biological Interest, NCBITaxon National Center for Biotechnology Information Taxon Ontology, PRO Protein Ontology, VO Vaccine Ontology.

