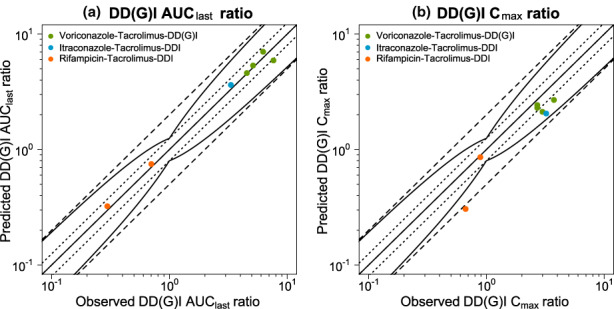
FIGURE 6.

Evaluation of the modeled DD(G)Is (Part II). Predicted versus observed DD(G)I AUClast (a) and DD(G)I Cmax (b) ratios are shown with the solid line representing the line of identity, dotted lines indicating 1.25‐fold and dashed lines twofold deviation from the respective observed value, along with the curved lines marking the prediction success limits proposed by Guest et al. 26 including 20% variability. Detailed information on all investigated DD(G)I studies is provided in Table S10. AUClast, area under the curve determined between first and last concentration measurements; Cmax, maximum whole blood concentration; DD(G)I, drug–drug(−gene) interaction; DDI, drug–drug interaction.
