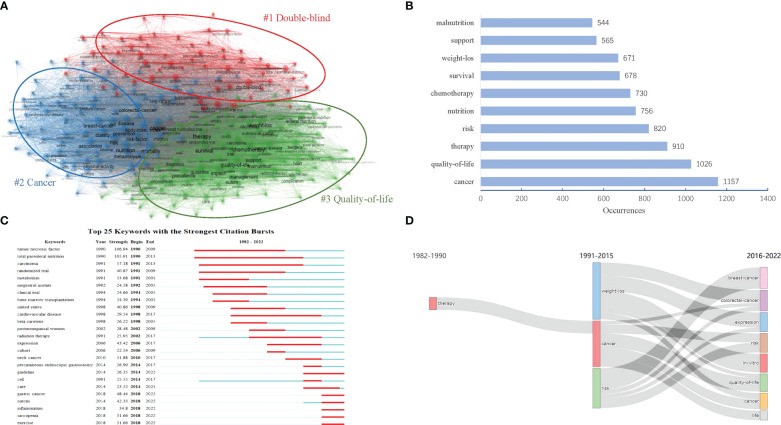
Figure 8.
Visualization map of keywords in the field of MNT on cancer from 1982 to 2022. (A) Keywords co-occurrence thematic network. The different colors mean different themes. (B) Top 10 keywords by number of occurrence. (C) Top 25 keywords with the strongest citation bursts. The length of the red bar represents the duration of the burst. (D) Map of thematic evolution. The line alignment represents the evolution direction of the themes. Line width represents the number of keywords.

