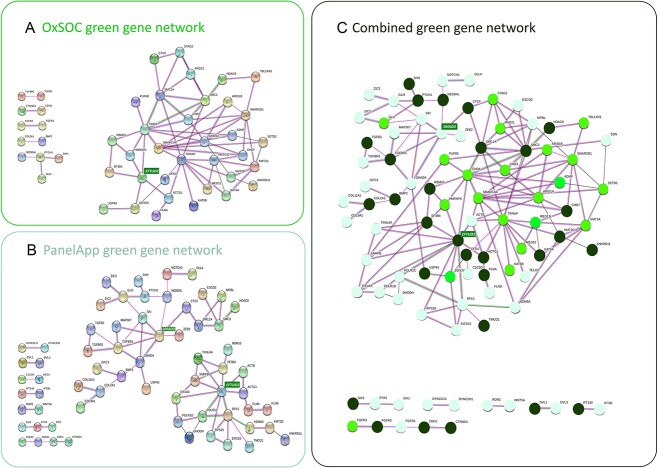
Figure 1.
Cleft Gene Networks. Genes are represented by balls and relationships by lines. Colour of the line depicts the type of evidence for the relationship; pink lines represent experimental evidence, green lines represent shared gene neighbourhood, black lines represent co-expression, blue lines represent protein homology and red lines represent gene fusions. The genes added by the OxSOC network (1a) allowed joined two distinct networks seen in the PA Clefting gene set (1b) through the connection of the EFTUD2 and SMAD3 hubs (1c). These hub genes are highlighted in green boxes. (A) Network of interconnected genes identified in the OxSOC green genes. Thirty-four of the 82 OxSOC green genes form a network connected by 66 edges with an average node degree of 3.88 (PPI enrichment, P = 1 × 10⁻¹⁶). (B) Network of existing PA green cleft genes. Forty-eight of the 142 PA green genes form two distinct networks connected by 62 edges with an average node degree of 2.62 (PPI enrichment, P = 7.22 × 10⁻¹¹). (C) Combined cleft network (OxSOC and PA green genes). Seventy-four of the 176 green genes form a network connected by 141 edges with an average node degree of 3.81 (PPI enrichment, P < 1 × 10⁻¹⁶). Genes that are found only in PA green list are shown as pastel green circles, genes that are included in both PA and OxSOC green lists are shown as dark green circles, genes that are found only in OxSOC green list are shown as bright green circles.

