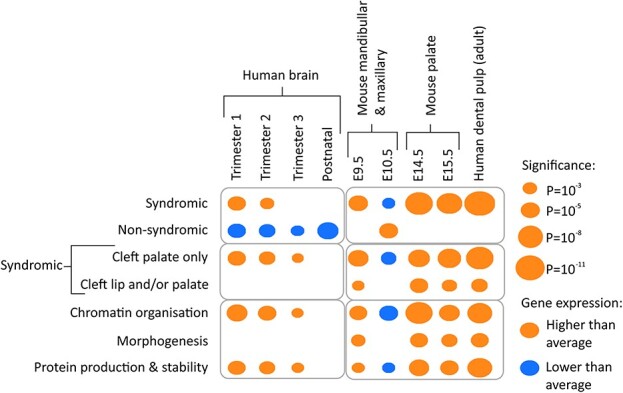
Figure 4.

Expression of gene subsets in brain and palate tissues. Average expression levels of all genes within each clinical gene subset (syndromic, non-syndromic, CPO, Cleft Lip and/or Palate CL/P) and functional network (morphogenesis, chromatin organization and protein production) were compared against the average expression levels of all protein coding genes within the same tissues. Gene lists that show higher than average expression are denoted by orange dots, gene lists that show lower than average expression are denoted by blue dots. The size of the dot represents the level of significance.
