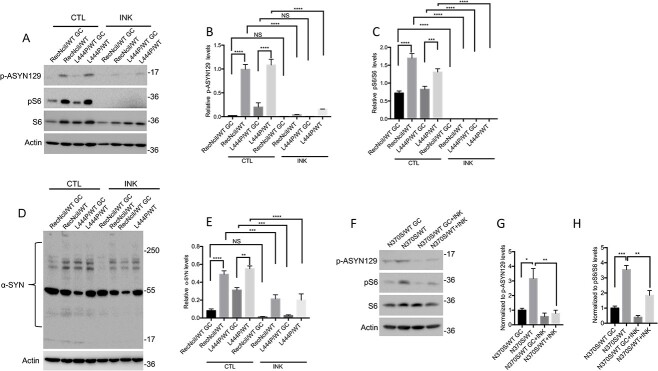
Figure 1.
mTOR inhibition in GBA1/PD–DA neurons reduces the levels of α-synuclein. (A) RecNciI/WT, L444P/WT GBA1/PD–DA neurons, and GC controls were either left untreated or were incubated with 50 nm INK128 (INK) for 24 h. Cell lysates were analyzed by WB with antibodies to p-ASYN129, pS6 and S6. The plots at the right of WB represent relative levels of p-ASYN129 (B) and pS6 normalized to total S6 (C). (D) RecNciI/WT, L444P/WT GBA1/PD–DA neurons and GC controls were either left untreated or were incubated as in A, shown previously. The detergent-insoluble fractions from cell lysates were analyzed by WB with antibodies to α-synuclein as described in the M&M. (E). The plot represents relative levels of α-synuclein in aggregates. (F) N370S/WT DA neurons and isogenic controls were treated as described in A, shown previously. Cell lysates were analyzed by WB using antibodies to p-ASYN129, pS6 and S6. The plots at the right of WBs represent relative levels of p-ASYN129 (G) and pS6 normalized to total S6 (H). Results plotted from three independent experiments (n = 3). Error bar represents the mean ± SEM. P-values were determined using one-way Analysis of Variance (ANOVA) followed by Bonferroni’s multiple comparisons test. Asterisks indicate the level of statistical significance: *P < 0.05, **P < 0.01, ***P < 0.001.

