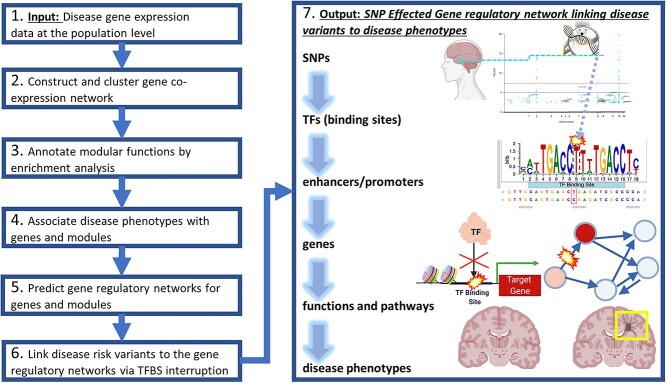
Figure 1.
Integrative analyses to predict GRNs from disease risk variants to phenotypes. Primarily, this analysis consists of seven major steps as a pipeline. First, it inputs the population gene expression data with phenotypic information (Step 1). Second, it uses that gene expression data to construct and cluster gene co-expression networks into gene modules (Step 2). Third, it performs enrichment analysis for these gene modules (Step 3). Fourth, it links genes and modules to various phenotypes from the input population (Step 4). Fifth, it predicts the Transcription Factors (TFs) and regulatory elements (e.g. TF binding sites along enhancers and/or promoters) that regulate genes and co-regulate modular genes as a gene regulatory network (GRN, Step5). Sixth, it further finds disease risk variants [e.g. Genome-Wide Association Studies (GWAS) Single Nucleotide Polymorphisms (SNPs)] that alter the binding sites of TFs from this GRN (Step 6). Seventh and finally, it outputs a SNP regulatory network (SNP-effected-GRN) linking functional non-coding disease risk variants to impacted TFs and enhancers/promoters to regulated genes and modules to enriched functions and pathways to disease phenotypes (Step 7). This network thus provides a deeper understanding of gene regulatory mechanisms in diseases. As a demo, in this paper, we applied this pipeline to AD population datasets from different brain regions. We predicted brain-specific GRNs for various AD phenotypes such as Alzheimer’s disease progression stages. Then, we built SNP-effected-GRNs by mapping single nucleotide polymorphisms (SNPs) from several AD GWAS datasets and a GWAS related to Covid-19 severity in Covid-positive individuals to these GRNs.

