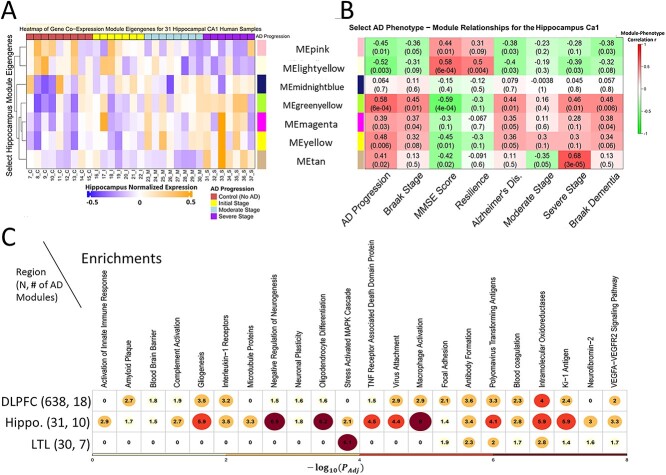
Figure 2.
Gene co-expression modules significantly associated with AD phenotypes show specific expression dynamic patterns across phenotypes and enriched functions and pathways. The left and right heatmaps on the top row correspond to the same set of select gene modules for the Hippocampus (and the corresponding heatmaps for the LTL and DLPFC are in Supplementary Material, Figure S2). (A) Shows the module eigengenes (MEs) of seven gene co-expression modules in the Hippocampal CA1 region where rows: modules and columns: individual human samples. Red: high expression level. Blue: low expression level. On the left hand side of this heatmap is a dendrogram tree based on agglomerative hierarchical clustering so that similar modules (in terms of values for MEs) cluster close together. (B) Shows the correlation coefficients and P-values for the same 7 Hippocampal CA1 gene modules and various select AD phenotypes (Supplementary Materials contain additional phenotypes). Row: modules. Columns: AD phenotypes. Red: highly positive correlation (r > 0). Green: highly negative correlation (r < 0). (C) Shows select biological functions and pathways that are enriched for modules positively correlated (P < 0.05, r > 0) with AD across the three brain regions. Values in the cells, circle sizes and gradient color (yellow to red) correspond to the highest −log10(adjust P-value) enrichment value of any gene module associated with the phenotype of AD diagnosis (i.e. AD phenotype) from that given brain region. There are N = 31 post-mortem human samples in the Hippocampus, N = 30 in the Lateral Temporal Lobe (LTL) and N = 638 in the Dorsolateral Prefrontal Cortex (DLPFC).

