
FIGURE 2.
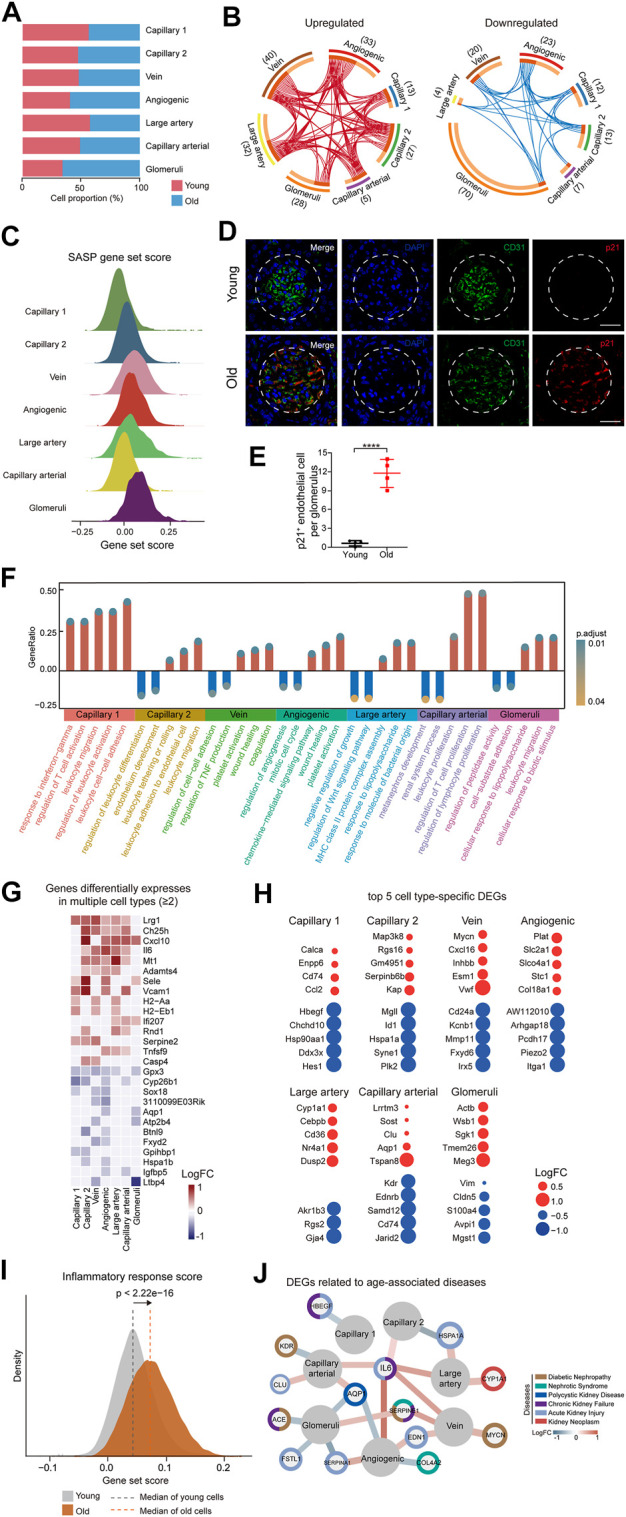
Cellular and molecular aging characteristics of the aged mouse renal ECs. (A) Bar plot showing the proportions of different renal ECs from young and old groups. (B) Circos plots showing aging-related up and down-regulated differentially expressed genes (DEGs) (adjusted p-value < 0.05, |logFC| > 0.25) of different endothelial cell types in the mouse kidney. Each connecting curve represents a gene that is up- or down-regulated in 2 cell types. (C) Density plots showing SASP gene set scores of different renal EC types in aged sample. (D) p21 and CD31 coimmunostaining in kidneys from young and aged mice. Original magnification ×600. Scale bar, 50 um. Panels are representative images of 4 young and old mice. (E) Quantification of p21-positive endothelial cells per glomeruli from young and aged mice. (F) Bar plot showing GO terms enriched for aging-related DEGs of different endothelial cell types in the mouse kidney. Y axis represents the ratio of differentially expressed genes to total DEGs in corresponding terms. (G) Heatmap showing genes differentially expressed in at least 2 cell types in mouse renal ECs. Only genes with same direction of differential expression among different cell types are included. (H) Dot plots showing top five cell-type-specific DEGs of different endothelial cell types. Only those with annotations are showed. Red dots represent upregulated genes and blue dots represent downregulated ones. (I) Density plots showing gene set scores of inflammatory response genes in renal endothelial cell types across young and old group. (J) Network plot showing DEGs associated with kidney diseases in different renal endothelial cell types.