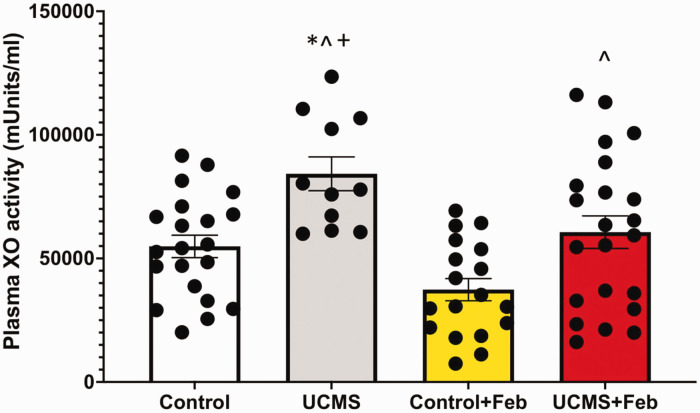
Figure 4.
Plasma XO activity. Plasma XO activity was measured with HPLC. *p < 0.05 vs control; ^p < 0.05 vs control + Feb; +p < 0.05 vs UCMS + Feb; mean ± SD. n = 12–23 mouse plasma samples/group. Two-way ANOVA with a group-by-drug interaction was performed, however, no significant interaction was established thus the main variable effect was reported.

