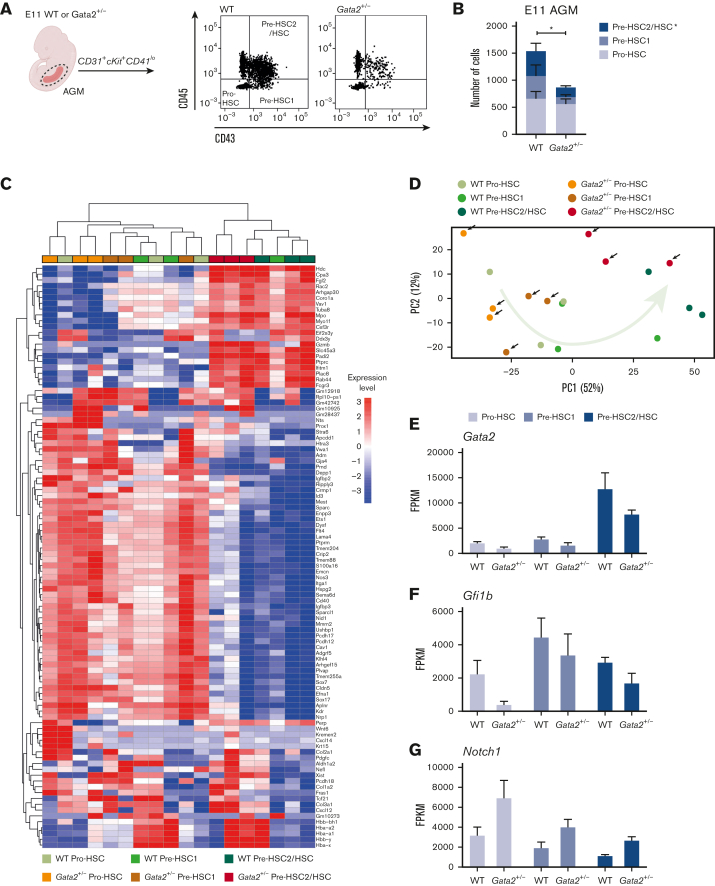
Figure 2.
HSPC maturation within IAHCs is impaired in Gata2+/− during EHT. (A) Gating strategy to determine HSPC maturation of E11 WT and Gata2+/− AGMs. Representative images of pro-HSC, pre-HSC1, and pre-HSC2 gating obtained from the WT (left) or Gata2+/− (right) AGMs. (B) Quantification of the number of pro-HSC, pre-HSC1, and pre-HSC2 populations in E11 WT (n = 11) or Gata2+/− (n = 13) AGMs. (C) Unbiased heatmap of the transcriptomic signatures of pro-HSC, pre-HSC1, and pre-HSC2 populations from 3 independent E11 WT or 3 independent Gata2+/− AGMs. (D) PCA showing the transcriptome of each sample obtained by RNA sequencing. Black arrows indicate Gata2+/− samples. The green arrow indicates the maturation trajectory based on the transcriptome of WT HSPCs. FPKM values of Gata2 (E), Gfi1b (F), and Notch1 (G) depicted for each stage of maturation and compared between the WT and Gata2+/−. Error bars represent standard error of the mean. Color code for samples according to genotype: WT samples in the shades of green and Gata2+/− samples in the shades of orange. Color code for maturation steps: pro-HSCs, light gray; pre-HSC1, gray; pre-HSC2, dark blue. ∗P < .05.

