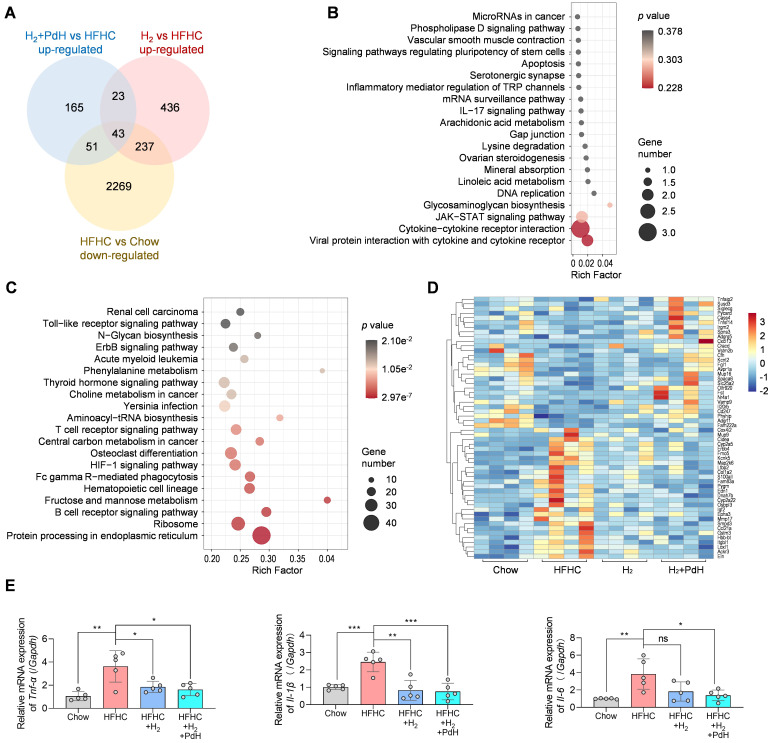
Figure 7.
Transcriptome analysis of liver samples. The Venn diagram of the DEGs in various comparisons (A), the KEGG enrichment analysis of the 43 genes clustered in the Venn diagram (B), the KEGG enrichment analysis of all the DEGs in comparison of H2+PdH and H2 groups (Log2|fold change| > 0, p value < 0.05) (C), the heatmap of DEGs in enriched pathways in comparison of H2+PdH and H2 groups (D), mRNA expression levels of TNF-α, IL-6 and IL-1β in liver tissues examined by real-time qPCR (E). Data were presented as mean ± standard deviation (Mean ± SD) with individual data. Student t-test was applied for comparison between groups. Difference was considered significant using asterisk as follows: *p < 0.05, **p < 0.01, ***p < 0.001.

