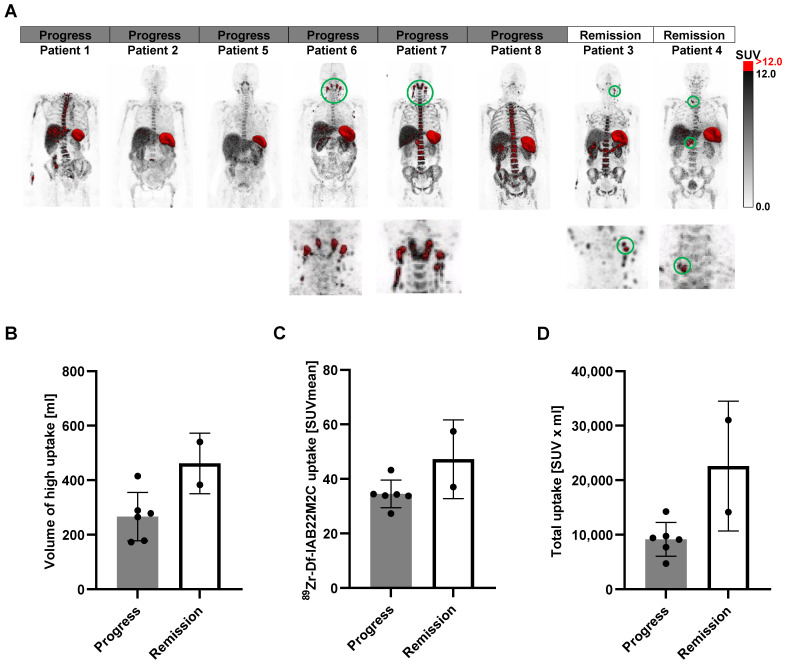
Figure 6.
A: The areas with the highest [89Zr]Zr-Df-IAB22M2C uptake (SUV > 12) were segmented (red). B: The volume of the high [89Zr]Zr-Df-IAB22M2C uptake areas was enhanced in the two responders to ICT compared with most nonresponders. C/D: The mean SUVs of these high [89Zr]Zr-Df-IAB22M2C uptake areas and the total uptake showed a tendency toward elevated values in responders compared to nonresponders.

