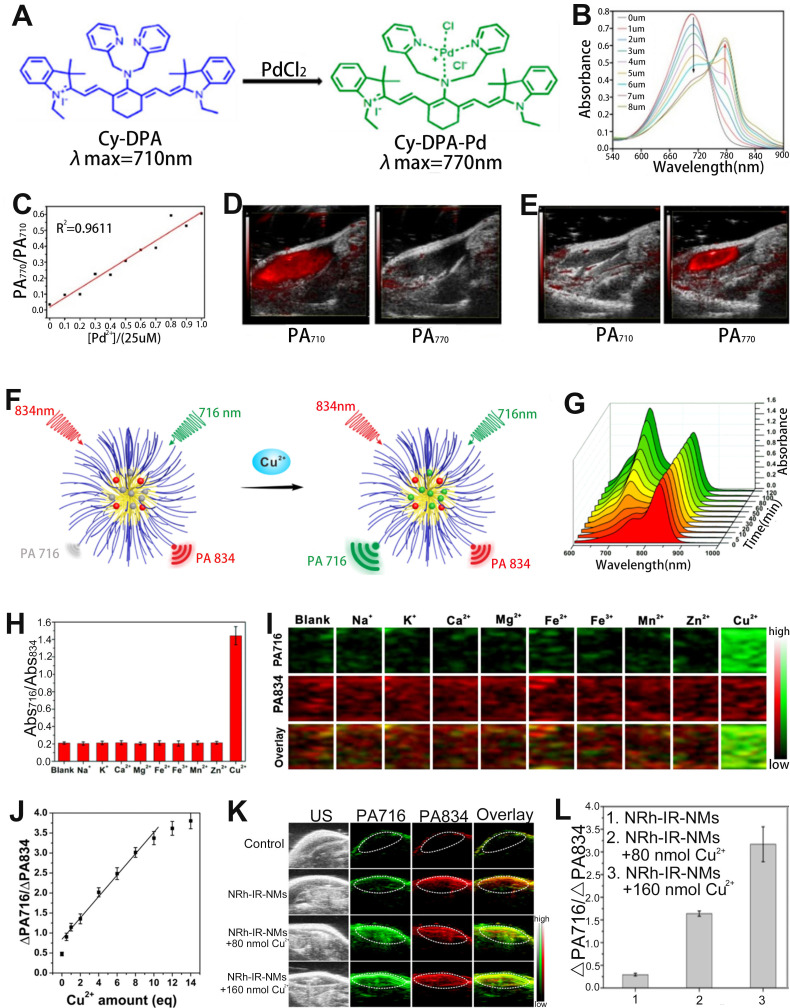
Figure 10.
(A) Sensing mechanism of Cy-PDA for Pd2+. (B) The absorption spectrum of the Cy-PDA after adding different concentrations of Pd2+. (C) PA signal ratio (PA770/PA710) as a function of Pd2+ concentration. (D) PA images at 710 nm and 770 nm after injection of Cy-DPA through the groin in mice. (E) PA images at 710 nm and 770 nm after co-injection of Cy-DPA and Pd2+ through the groin in mice. (F) The sensing mechanism of NRh-IR-NMS for Cu2+. (G) Change of absorption spectra of NRh-IR-NM solution with time after adding Cu2+ solution. (H) Changes in Abs716/Abs834 of probes after incubation with different metal ions. (I) PA images of NRh-IR-NMS after reaction with metal ions. (J) The relationship between Cu2+ concentration and PA signal ratio. (K) PA images of mice after different treatments and (L) corresponding ΔPA716/ΔPA834. (A-E) Adapted with permission from 139, Copyright 2020 American Chemical Society. (F-L) Adapted with permission from 143, Copyright 2018 American Chemical Society.

