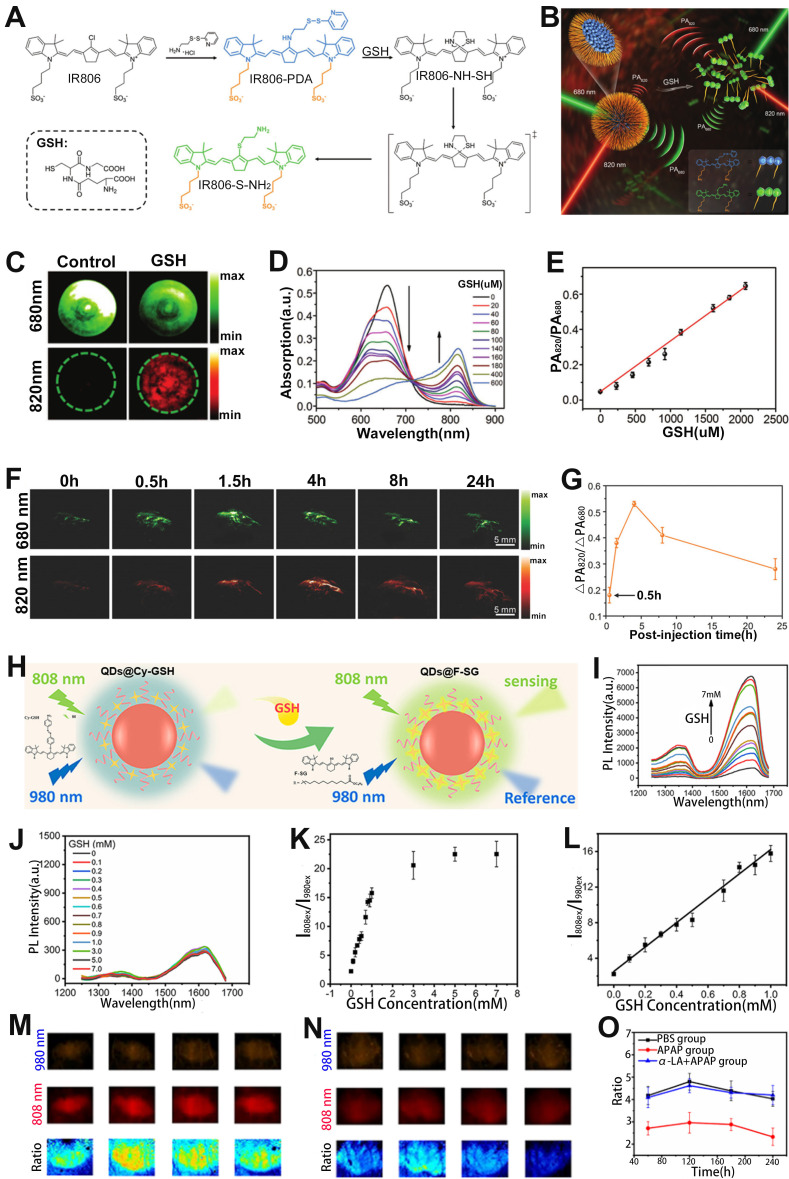
Figure 11.
(A) Molecular structure of the IR806-PDA probe and the reaction pathway with GSH. (B) Proposed mechanism of the ratiometric probe for GSH sensing. (C) PA imaging at 680 nm and 820 nm of probes after different treatments. (D) GSH responsive UV-vis absorption spectra of IR806-PDA nanoprobe. (E) Relationship between GSH concentration and PA signal ratio. (F) PA images at different post-injection time. (G) Relationship between ΔPA820/ΔPA680 and post-injection time. (H) Schematic illustration of the ratiometric FL probe for sensing of GSH. FL spectra of probe incubated with different concentrations of GSH under excitation at (I) 808 nm and (J) 980 nm. (K) The relationship between FL signal ratio and GSH concentration. (L) GSH concentration as a function of FL signal ratio. FL signal intensity in mouse liver treated with (M) PBS and (N) APAP. (O) The change of FL signal ratio (I808ex/I980ex) with time after different treatments. (A-G) Adapted with permission from 152, Copyright 2018 WILEY-VCH. (H-O) Adapted with permission from 153, Copyright 2021 American Chemical Society.

