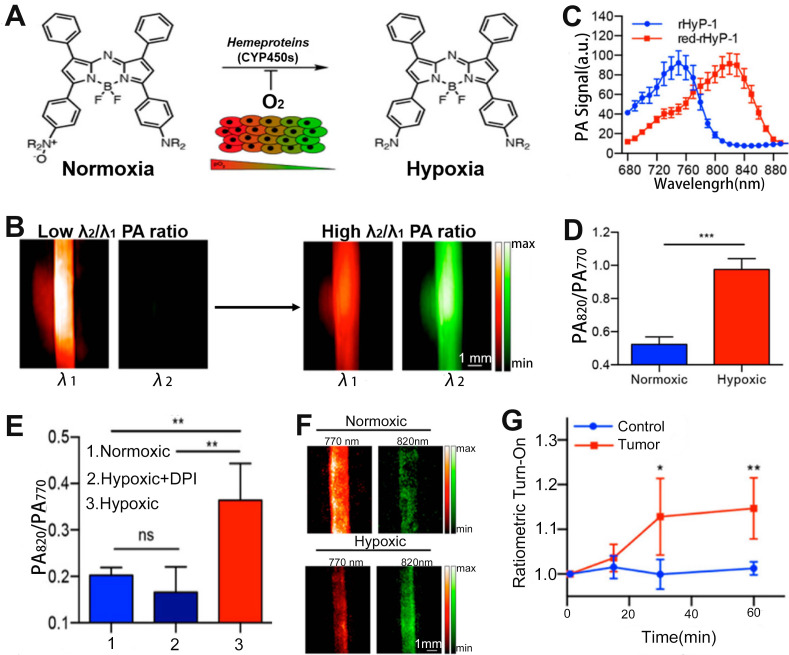
Figure 13.
(A) Study on the sensing mechanism of probes for hypoxia. (B) Changes in PA signal ratio before and after hypoxia. (C) PA spectra of rHyP-1 and red rHyP-1. (D) Changes in PA signal ratio after 1 h incubation in hypoxic or normoxic conditions. (E) Changes of PA signal ratio after different treatment. (F) Representative PA images of rHyP-1 probe solutions after incubatiom with rat liver microsomes. (G) After rHyP-1 was injected intratumorally or subcutaneously (control) into the tumor-bearing mice, the ratiometric PA turn-on. (A-G) Adapted with permission from 171, Copyright 2018 American Chemical Society.

