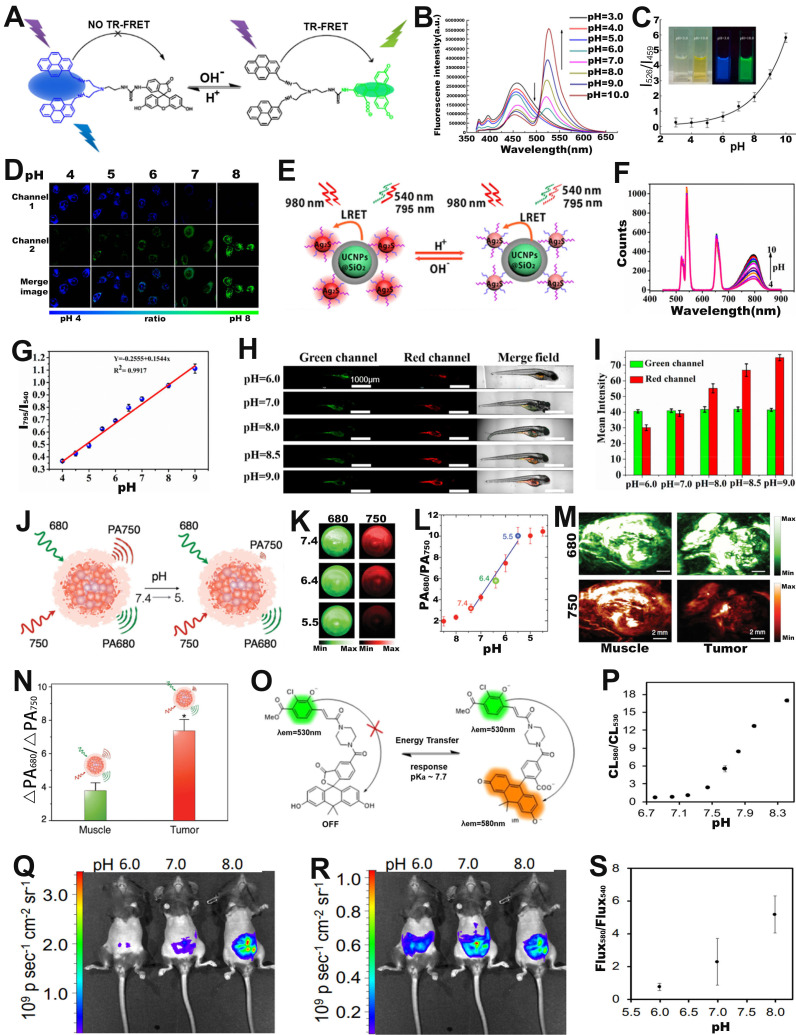
Figure 6.
(A) The structure and response mechanisms of FRET-based ratiometric bispyrene-fluorescein hybrid probe. (B) The FL intensity changes of PF probe with pH value. (C) The relationship between pH and FL signal ratio (I526/I459). (D) Confocal FL image after incubation of probe with Hela cells. (E) Schematic diagram of pH sensing mechanism of UCNPs@SiO2-Ag2S probe. (F) The luminescence spectrum changes with pH value. (G) The FL signal ratio as a function of pH. (H) Confocal images of zebrafish with probes incubated at different pH, and (I) corresponding luminescence intensity ratio. (J) Proposed mechanism of ratiometric probe SNOS for pH sensing. (K) PA imaging at different pH values. (L) The relationship between pH value and PA signal ratio. (M) PA images of muscle and tumor site after injection of probe, and (N) corresponding PA680 nm/PA750 nm ratio. (O) Chemical structure and sensing mechanism of ratiometric CL probe. (P) Relationship between pH and CL580 nm/CL530 nm. CL images of ratio-pHCl-1 injected into the mice using a (Q) 580 nm filter or (R) 540 nm filter in the IVIS Spectrum. (S) The relationship between pH value and Flux580/Flux540. (A-D) Adapted with permission from 91, Copyright 2014 American Chemical Society. (E-I) Adapted with permission from 97, Copyright 2019 American Chemical Society. (J-N) Adapted with permission from 100, Copyright 2016 WILEY-VCH. (O-S) Adapted with permission from 101, Copyright 2020 American Chemical Society.

