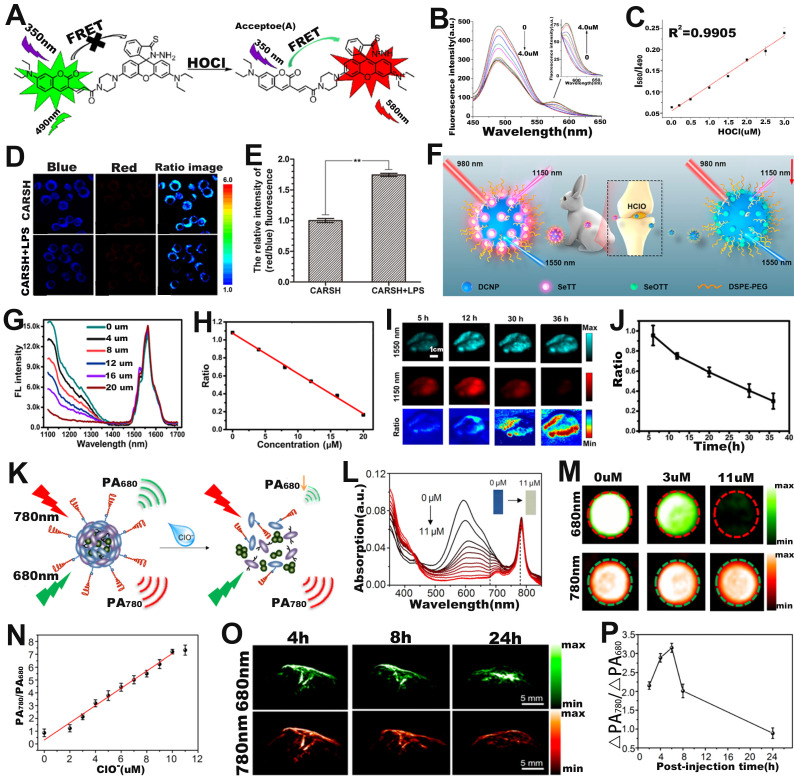
Figure 7.
(A) Chemical structure and sensing mechanism of CARSH probe. (B) The FL intensity changes with the increase of HOCl concentration. (C) The relationship between HOCl concentration and FL signal ratio (I580/I490). (D) FL images of RAW264.7 cell after incubation with CARSH probe, and (E) corresponding ratio (red/blue) of FL intensity. (F) Proposed mechanisms of DCNP@SeTT@PEG probes for sensing of HClO within tumor and inflammation of rabbit models. (G) The FL intensity changes with the HClO concentration, and (H) corresponding I1150 nm/I1550 nm. (I) FL images in mice after intravenous injection of probe, and (J) I1150 nm/I1550 nm as a function of time. (K) Mechanism of SOA@NIR775 probe for ratiometric PA sensing of ClO-. (L) Changes in the absorption spectra of probes after the addition of different concentrations of ClO-. (M) PA images of probes treated with different concentrations of ClO-. (N) Variation of PA signal ratio with ClO- concentration. (O) PA images of subcutaneous 4T1 tumor after intravenous injection of probes, and (P) corresponding PA signal ratio. (A-E) Adapted with permission from 111, Copyright 2016 Elsevier. (F-J) Adapted with permission from 112, Copyright 2020 American Chemical Society. (K-P) Adapted with permission from 116, Copyright 2017 American Chemical Society.

