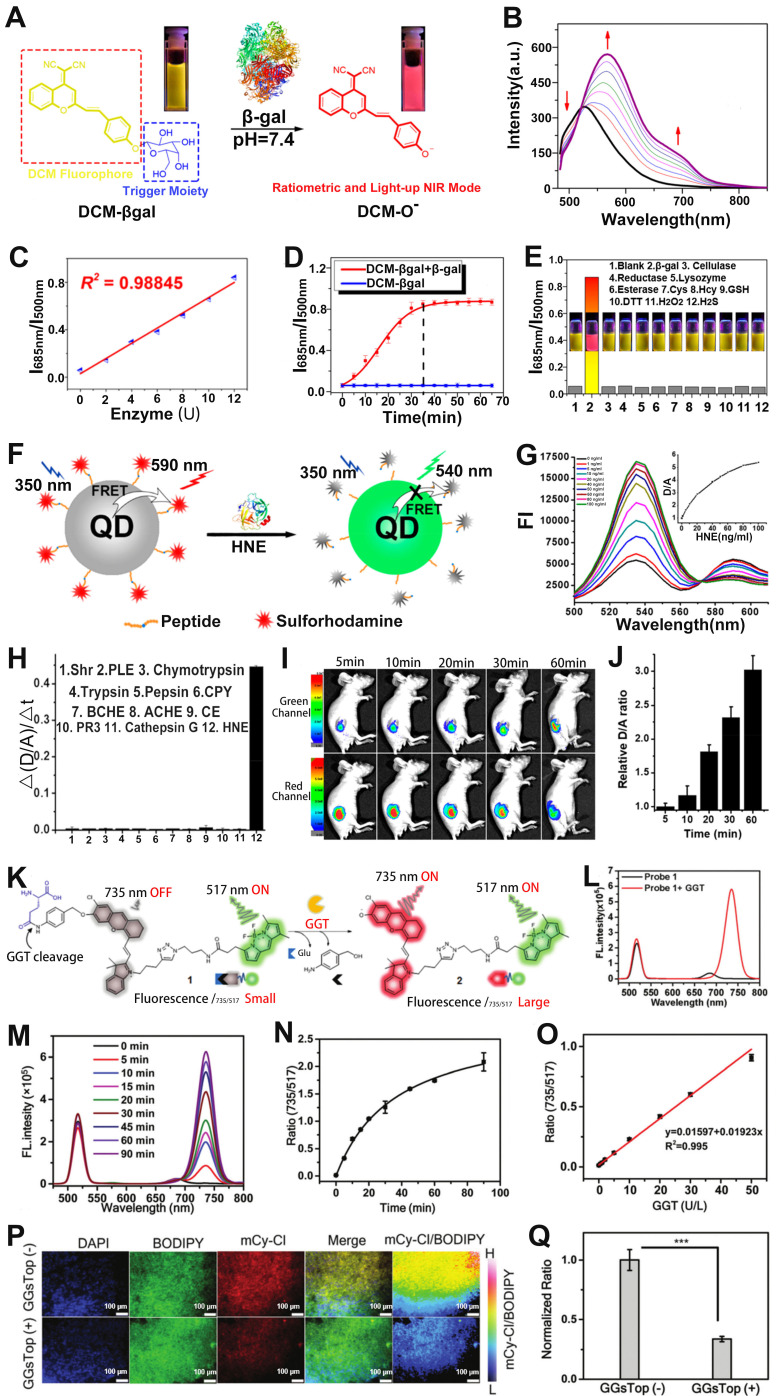
Figure 9.
(A) Sensing mechanism of DCM-βgal under the action of β-gal enzyme. (B) Emission spectrum changes as a function of time. (C) Changes in FL signal ratio with increasing enzyme concentration. (D) FL signal ratio changes with time before and after addition of β-gal enzyme. (E) Changes in the FL ratio after treatment with different analytes. (F) Schematic diagram of sensing principle of QDP probe. (G) Changes in the FL spectra after treatment with different concentrations of HNE. (H) Changes in signal ratio after different analyte treatments. (I) FL images of tumor at different post-injection, and (J) corresponding D/A ratio. (K) The chemical structure of probe 1 and the principle of enzyme sensing. (L) FL spectra of probe after reaction with GGT. (M) FL spectra of the probe as a function of time after reaction with GGT. (N) Change of FL signal ratio with time. (O) The relationship between GGT concentration and FL signal ratio (FL735/FL517). (P) FL imaging of GGT activity in tumor tissue sections, and (Q) corresponding ratio (FL735/FL517). (A-E) Adapted with permission from 130, Copyright 2016 American Chemical Society. (F-J) Adapted with permission from 134, Copyright 2020 American Chemical Society. (K-Q) Adapted with permission from 135, Copyright 2021 Royal Society of Chemistry.

