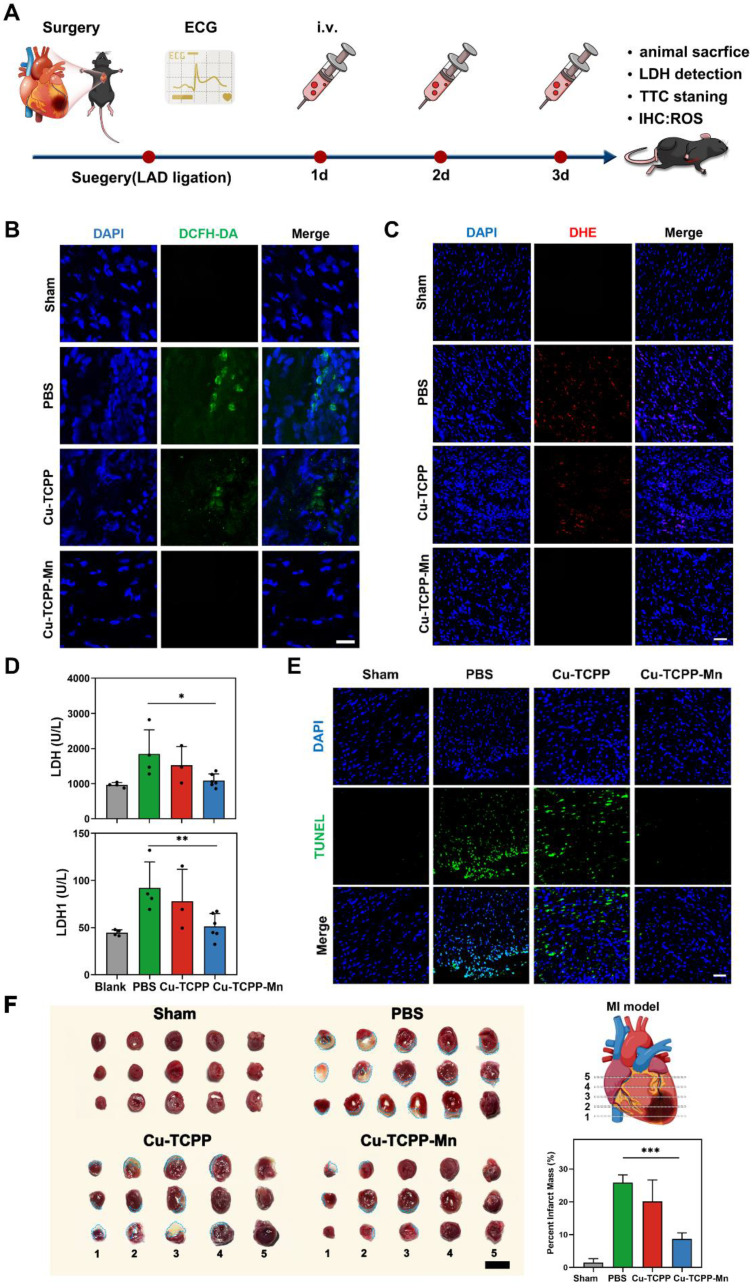
Figure 4.
In vivo anti-inflammation effect of Cu-TCPP-Mn nanozyme on MI mice. (A) The schematic of the study design. Representative ROS staining images of heart tissues harvested from MI mice models treated with PBS, Cu-TCPP and Cu-TCPP-Mn using DCFH-DA probe (B, Scale bar, 25 μm) and DHE probe (C, Scale bar, 50 μm). (D) the LDH and LDH1 concentrations of mouse serum with different treatment. (E) Immunofluorescent staining of TUNEL in the ischemic heart after different treatments. Scale bar, 50 μm. (F) Representative TTC staining images and quantitative data of Sham or MI heart slices treated with PBS, Cu-TCPP and Cu-TCPP-Mn, with the infarct area shown in blue dashed line. Scale bar, 100 mm. Data are presented as mean ± S.D. (n = 5). The comparisons between samples were operated by one-way ANOVA. * indicates P < 0.05; ** indicates P < 0.01; *** indicates P < 0.001; ns indicates P > 0.05 with no significance.

