Figure 5.
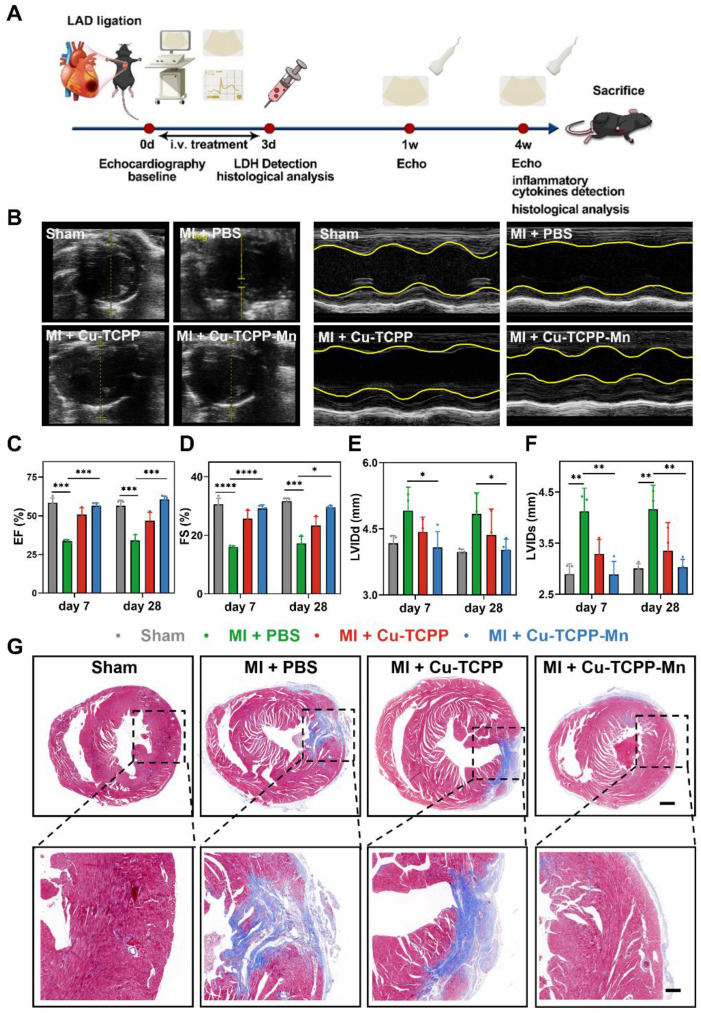
Therapeutic efficacy of Cu-TCPP-Mn on MI mice. (A) The schematic of the study design. (B) Representative echocardiographic images and corresponding M-mode images of MI mouse models at day 7 post treatments. The yellow wavy line (right panel) in the top and bottom area indicates left ventricular wall thickness and left ventricular posterior wall thickness. Distance between two wavy lines indicates left ventricular dimension. (C) Ejection fraction (EF) and (D) fractional shortening (FS) were evaluated by echocardiography after different treatments at one week and four weeks, respectively (n = 3-4 per group). (E) Left ventricular end diastolic dimension (LVIDd) and (F) left ventricular end systolic dimension (LVIDs) were evaluated by echocardiography after different treatments at one week and four weeks, respectively (n = 3-4 per group). (G) Representative Masson's trichrome staining images of infarcted hearts 4 weeks after injection (blue represents scar tissue; red represents viable myocardium). Scale bar, 500 μm (top), 150 μm (bottom). Data are presented as mean ± S.D. The comparisons between samples were operated by one-way ANOVA. * indicates P < 0.05; ** indicates P < 0.01; *** indicates P < 0.001; ns indicates P > 0.05 with no significance.

