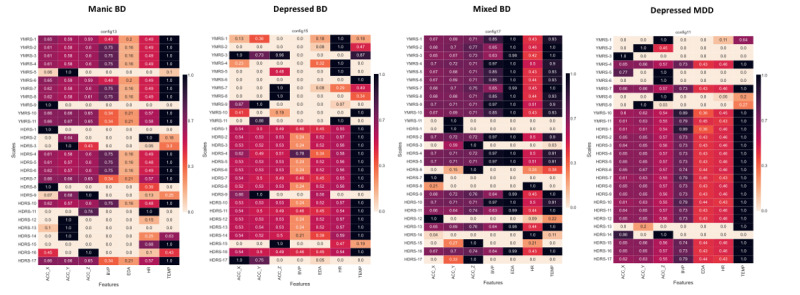
Figure 3.

Tile plots for the normalized mutual information analysis between physiological data and psychometric scales’ items: intra-individual level. For each scales’ item the mutual information (MI) with respect to each of the channels was measured and scaled to 0 to 1 dividing by the maximum MI value for that item. Values of zero indicate no associations, values of 1 indicate the maximum recorded MI across all channels for an individual item. ACC_X: x-axis acceleration; ACC_Y: y-axis acceleration; ACC_Z: z-axis acceleration; BD: bipolar disorder; BVP: blood volume pulse; EDA: electrodermal activity; HDRS: Hamilton Depression Rating Scale; HR: heart rate; MDD: major depressive disorder; TEMP: temperature; YMRS: Young Mania Rating Scale.
