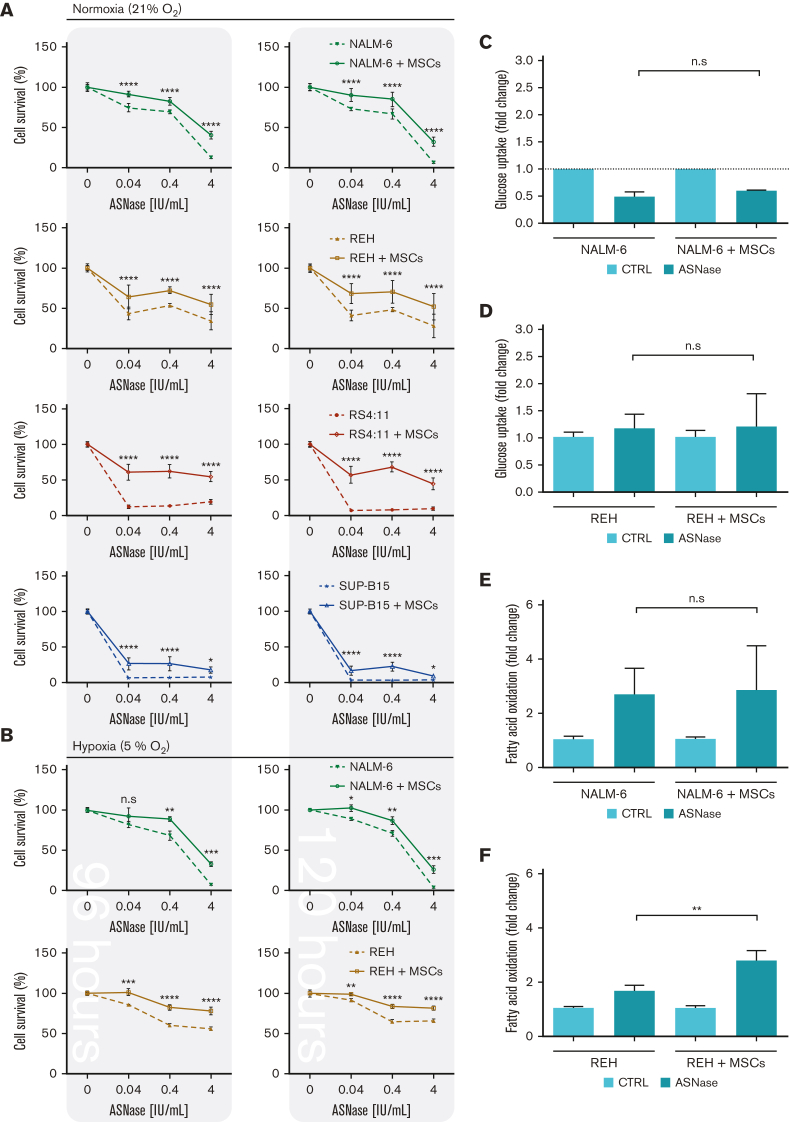
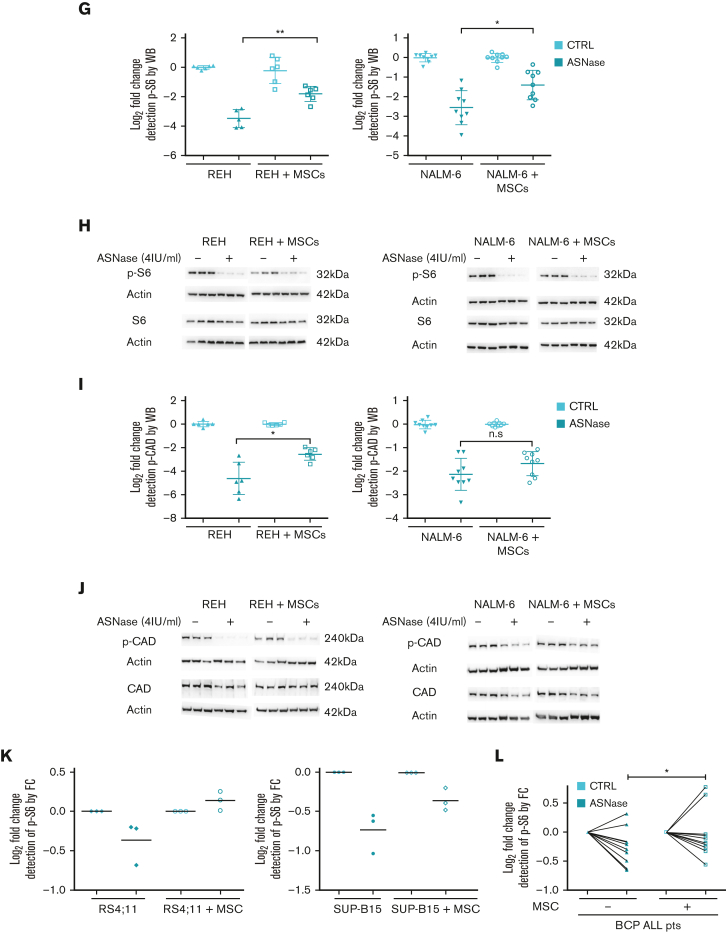
Figure 1.
Rescued leukemic cells by the coculture model upon ASNase treatment showed restored p-S6 and p-CAD. (A-B) Growth assay of leukemic cells by flow cytometry. Leukemic cell lines were seeded in the presence and absence of MSCs and cultured with increasing concentrations of transient ASNase treatment for a specific time. After determining the absolute number of cells, the results were normalized to untreated samples and presented as the percentage of cell survival. Each symbol of the survival line represents the mean ± SD from (A) 3 independent experiments performed in biological triplicates and (B) a biological triplicate experiment. (C-F) Leukemic cells (NALM-6; REH) in mono and cocultures were cultured with transient ASNase treatment (4 IU/mL) for 48 hours, then GU measurement (C-D) and FAO measurement (E-F) were performed. Bar graphs represent the mean ± SD of the results in fold change normalized to the untreated sample from at least 2 independent experiments performed in biological triplicates. ∗∗P-value = .0043. (G-J) mTOR activity analysis by detecting the phosphorylated form of its downstream proteins (S6 and CAD) using western blotting. Leukemic cells in mono and cocultures were cultured with 4 IU/mL of transient ASNase treatment for 48 hours (NALM-6) or 72 hours (REH). The results were quantified and normalized to β-actin, presented as the log2 fold change relative to that of untreated samples. Every point of the dot plot represents the result of each biological triplicate from the n = 2 to 3 independent experiments. (G) p-S6 protein quantification (REH, ∗∗P-value = .0043; and NALM-6, ∗P-value = .0106). (H) p-S6, S6 and β-actin of a representative western blot. (I) p-CAD protein quantification (∗P-value = .0152), (J) p-CAD, CAD and β-actin of a representative western blot. (K-L) Results from the phosphorylated form of S6 measured by spectral cytometry in leukemic cells. Approximately 4.00E+06 leukemic cells, either cell lines (RS4:11 and SUP-B15, K) or primary cells (L), were seeded in the presence and absence of MSCs (2.00E+05 cells per 24mm insert transwell) and cultured with 4 IU/mL of transient ASNase treatment for 8 (K, L) and 24 hours (L). Two-way ANOVA (pairwise comparison; A-B), two-tailed Mann-Whitney test (D-J) and Wilcoxon test (K) were used to determine statistically significant differences. ∗P < .05, ∗∗P < .01 ∗∗∗P < .001, ∗∗∗∗P < .0001. ANOVA, analysis of variance; CTRL, control; FC, flow cytometry; n.s, not significant; p-S6, phosphorylated S6 ribosomal protein; p-CAD, phosphorylated CAD; WB, western blot.


