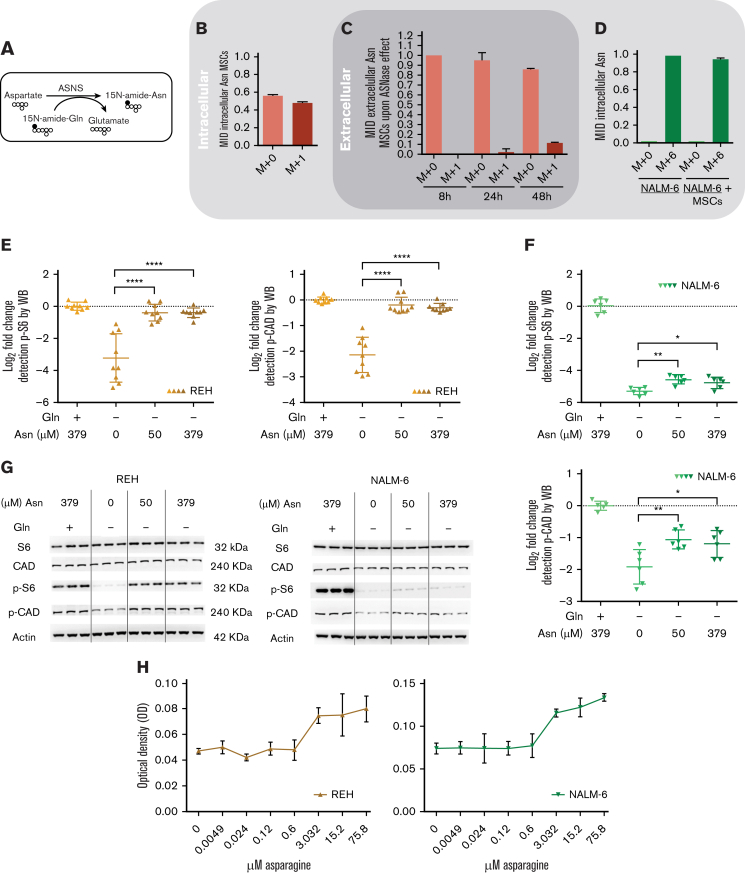
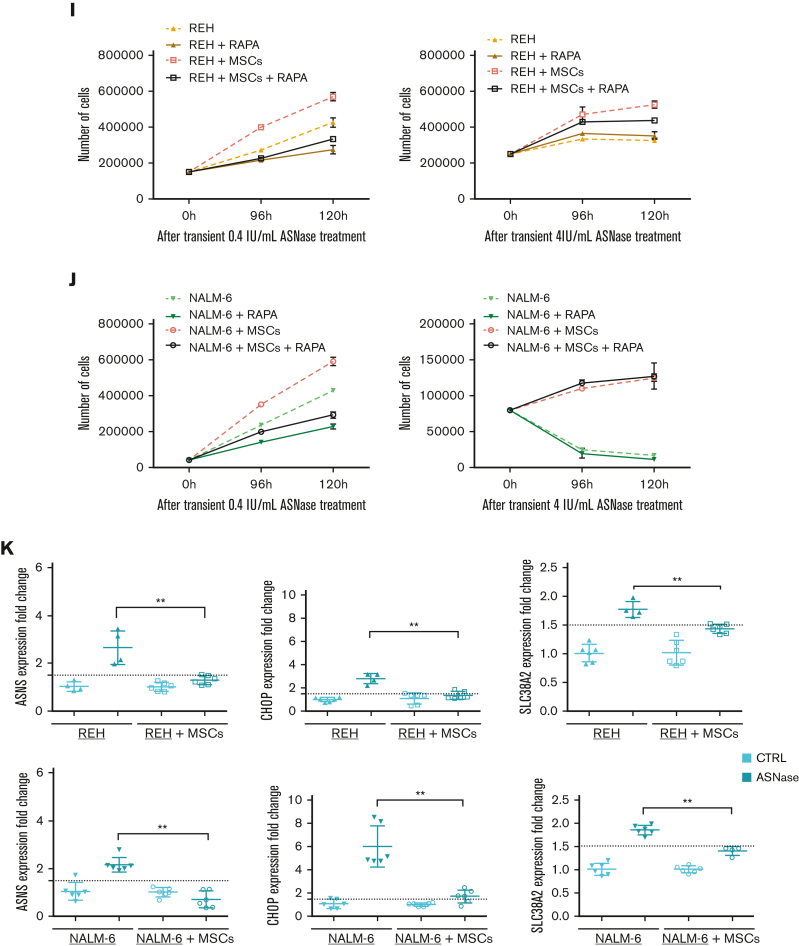
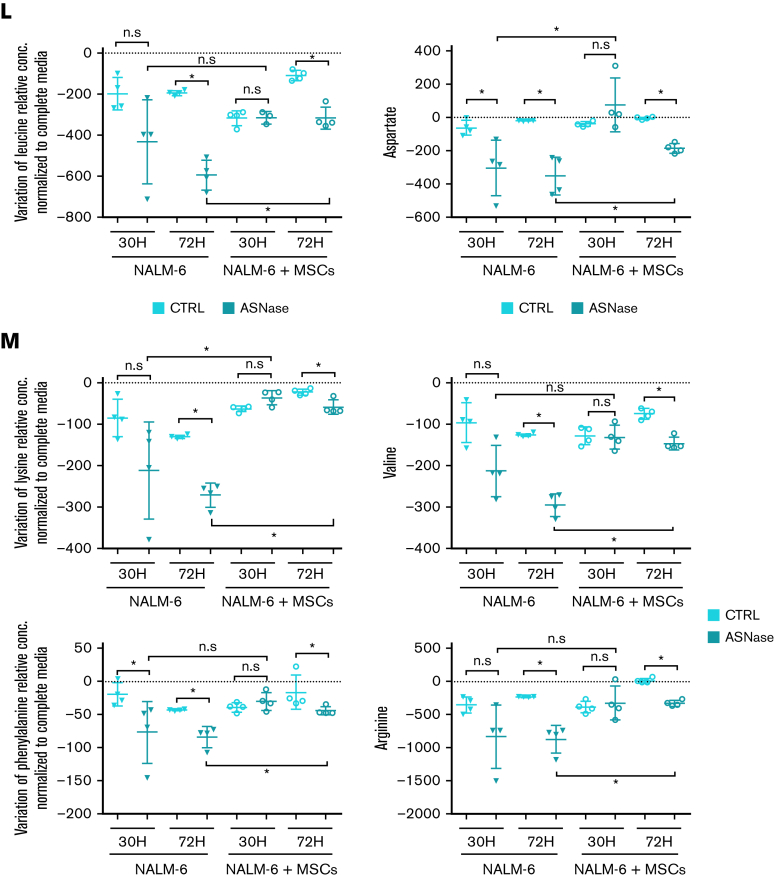
Figure 2.
MSCs from the coculture model de novo synthesized and released Asn, which mitigated ASNase-nutrient stress and restored p-S6 and p-CAD in leukemic cells. (A-D) Detection of the efflux of de novo synthesized Asn from MSCs to the media using SIT with N15-amide-Gln. Each bar graph represents the results as mean ± SD of MID from a biological triplicate experiment. (A) Scheme of de novo Asn synthesis showing the transfer of the labeled isotope from N15-amide-Gln to N15-amide-Asn (M+1). (B) MID of intracellular Asn in MSCs cultured with free Asn complete medium supplemented with N-amide-Gln for 7 days. This complete medium was prepared from a modified RPMI lacking Gln, Asn, Glu and Asp, which was supplemented then with 2 mM of N-amide-Gln, 150 μM of Asp and 136 μM of Glu. (C) MID of Asn in the medium (extracellular Asn) simulating ASNase effect cultured with MSCs for specific time-points. This medium was prepared using the modified RPMI mentioned in (B), supplemented with a reduced concentration of Gln (500 μM), 528 μM Asp and 2.136 mM Glu. The last 2 concentrations were adjusted from technical RPMI formulation assuming the complete conversion (1:1) due to the action of ASNase on Asn and Gln to Asp and Glu. The reduced Gln concentration ensured the pathways' stability, avoiding the labeled isotope loss in Asn. (D) MID of intracellular Asn in NALM-6 in mono and cocultures after 24 hours of culture with Gln-free medium (the modified RPMI, B) supplemented with 15N2-13C4-Asn (379 μM), 150 μM Asp and 136 μM Glu. (E-F) mTOR activity analysis in REH and NALM-6 cells by detecting the phosphorylated form of its downstream protein (S6 and CAD) using western blotting. Leukemic cells (7.50E + 05 cells per mL) were cultured with a medium (the modified RPMI, B) simulating the ASNase effect (0 Gln, 528 μM Asp, and 2.136 mM Glu), supplemented with increasing concentrations of Asn for 24 hours. The results were quantified and normalized to β-actin, presented as the log2 fold change relative to that of untreated samples. Every point of the dot plot represents the result of each biological triplicate from the n = 2 to 3 independent experiments. (G) p-S6, S6, p-CAD, p-CAD and β-actin of a representative western blot. (H) Cell proliferation of leukemic cells using MTS assay. Leukemic cells were cultured with a medium simulating the ASNase effect mentioned in (E), supplemented with increasing Asn concentrations for 72 hours. The results are shown in OD, and symbols represent the means ± SD results from n = 1 to 3 independent experiments in 6 biological replicates. (I-J) Growth assay of leukemic cells undergoing transient ASNase treatment combined or not with 25nM of rapamycin (RAPA). Each symbol on the curve represents the mean ± SD from a biological triplicate experiment. (K) Relative quantification of the expression of ASNS, CHOP, and SLC38A2 using qPCR. The gene expression was measured in leukemic cells (underlined cell line represents the one analyzed) in the presence and absence of MSCs cultured with 4 IU/mL of transient ASNase treatment for 6 hours. Results were normalized to the average of 2 housekeepers’ genes and calculated the fold change to untreated samples per time point and condition. Each symbol of the dot plot represents the result of each duplicate measurement from n = 1 to 2 independent experiments in a biological triplicate. ASNS, P-value = .0095 (REH) and P-value = .0022 (NALM-6); CHOP, P-value = .0095 (REH) and P-value = .0022 (NALM-6); SLC38A2, P-value = .0095 (REH) and P-value = .0095 (NALM-6). The dotted line marks a fold change of 1.5. (L) The flux of extracellular amino acids was determined by high-performance liquid chromatography (HPLC) in mono and coculture models. NALM-6 cells (0.30E + 06 cells per mL) were seeded with or without MSCs and cultured with 4 IU/mL transient ASNase treatment for 30 and 72 hours. The culture media were collected to determine amino acid concentrations. Results were normalized following a two-step process; (1) Extraction of the amino acid concentrations in complete medium at time 0 and (2) normalization of the amino acid concentrations to the number of cells. This normalization allows us to distinguish the direction of the amino acid flow; influx and efflux are represented as values below and above zero (marked with a dotted line), respectively. Each symbol represents the result of each replicate from a biological quadruplicate experiment. Two-tailed Mann-Whitney test was assessed to determine statistically significant differences between 2 groups. ∗P < .05, ∗∗P < .01, ∗∗∗∗P < .0001. ASNS, asparagine synthetase; MID, mass isotopologue distribution; n.s, not significant; OD, optical density; qPCR, quantitative polymerase chain reaction.


