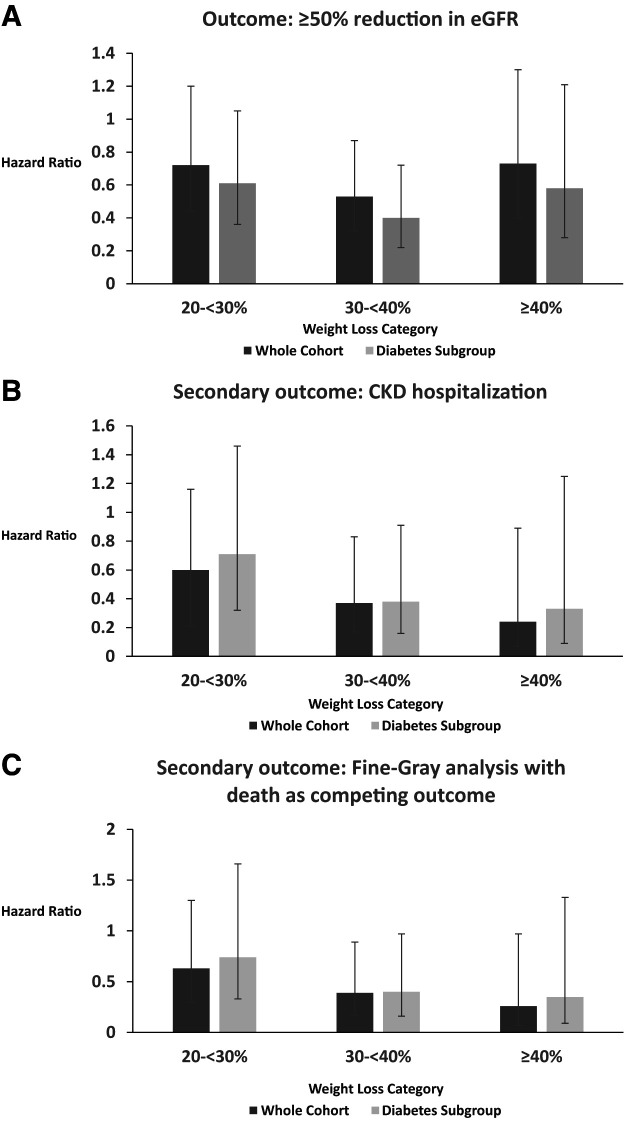
Figure 3.
Outcomes after BS by WL category (20 to <30%, 30 to <40%, and ≥40%). The <20% WL group is the comparator. Each outcome is presented for the whole cohort and the subgroup with diabetes. Lines indicate 95% CIs. A: Primary outcome (≥50% reduction in eGFR). B: Secondary outcome (CKD hospitalization). C: Secondary outcome with Fine-Gray analysis with death as a competing outcome.

