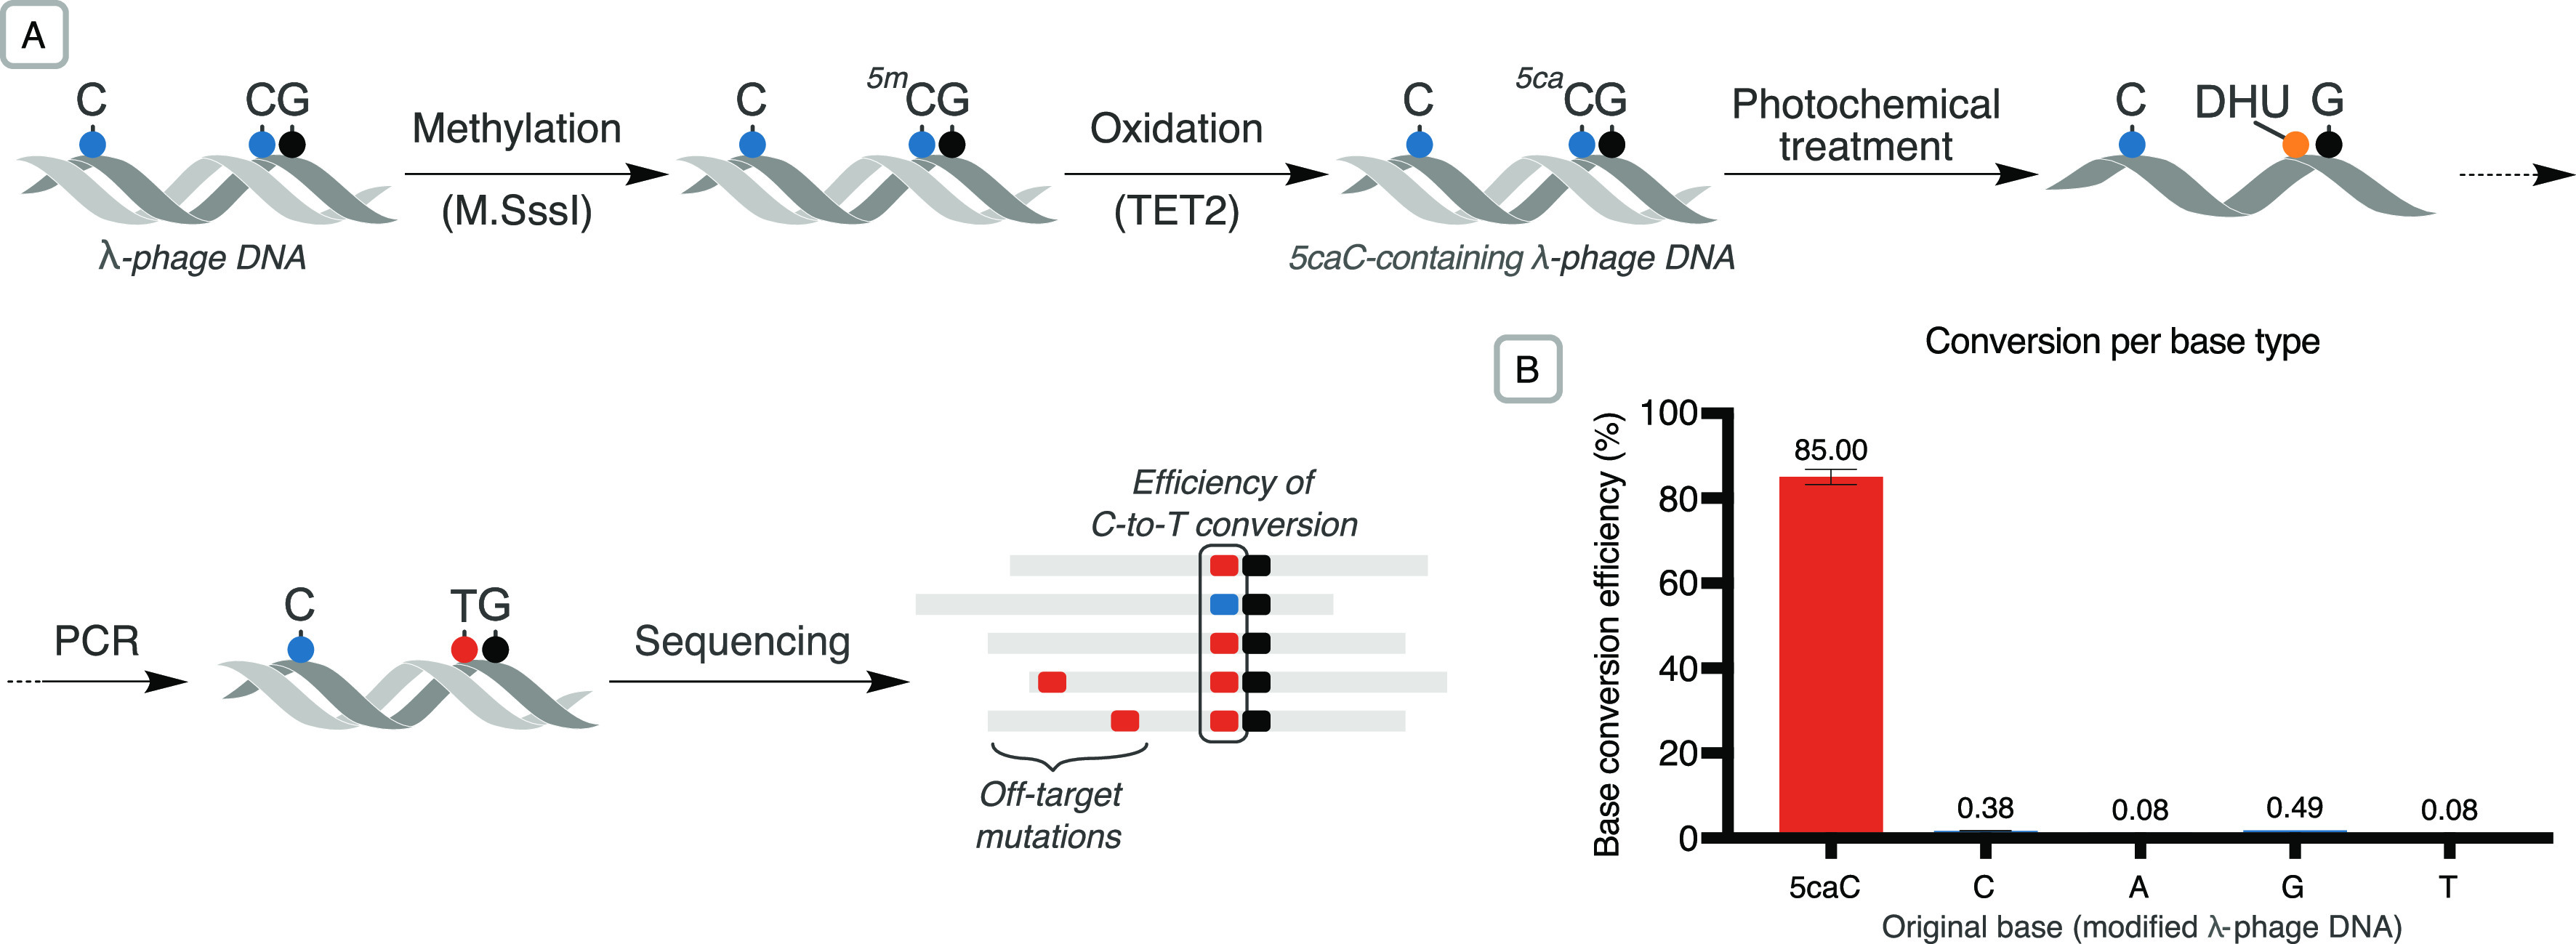
Figure 6.

(A) Modified λ-phage DNA was subjected to various photochemical conditions and the results evaluated via next-generation sequencing. (B) Barplot of mean base conversion rates (±std deviation, n = 2) resulting from photochemical treatment of the modified genome (0.5 M thioglycerol, 0.1 mM photocatalyst, 20 min illumination followed by 2 h hydrolysis at 37 °C; Table S6, entry 8). The rate of on-target 5caC-to-T transitions observed at CpG sites during base calling was corrected to account for unmethylated and unoxidized bases.
