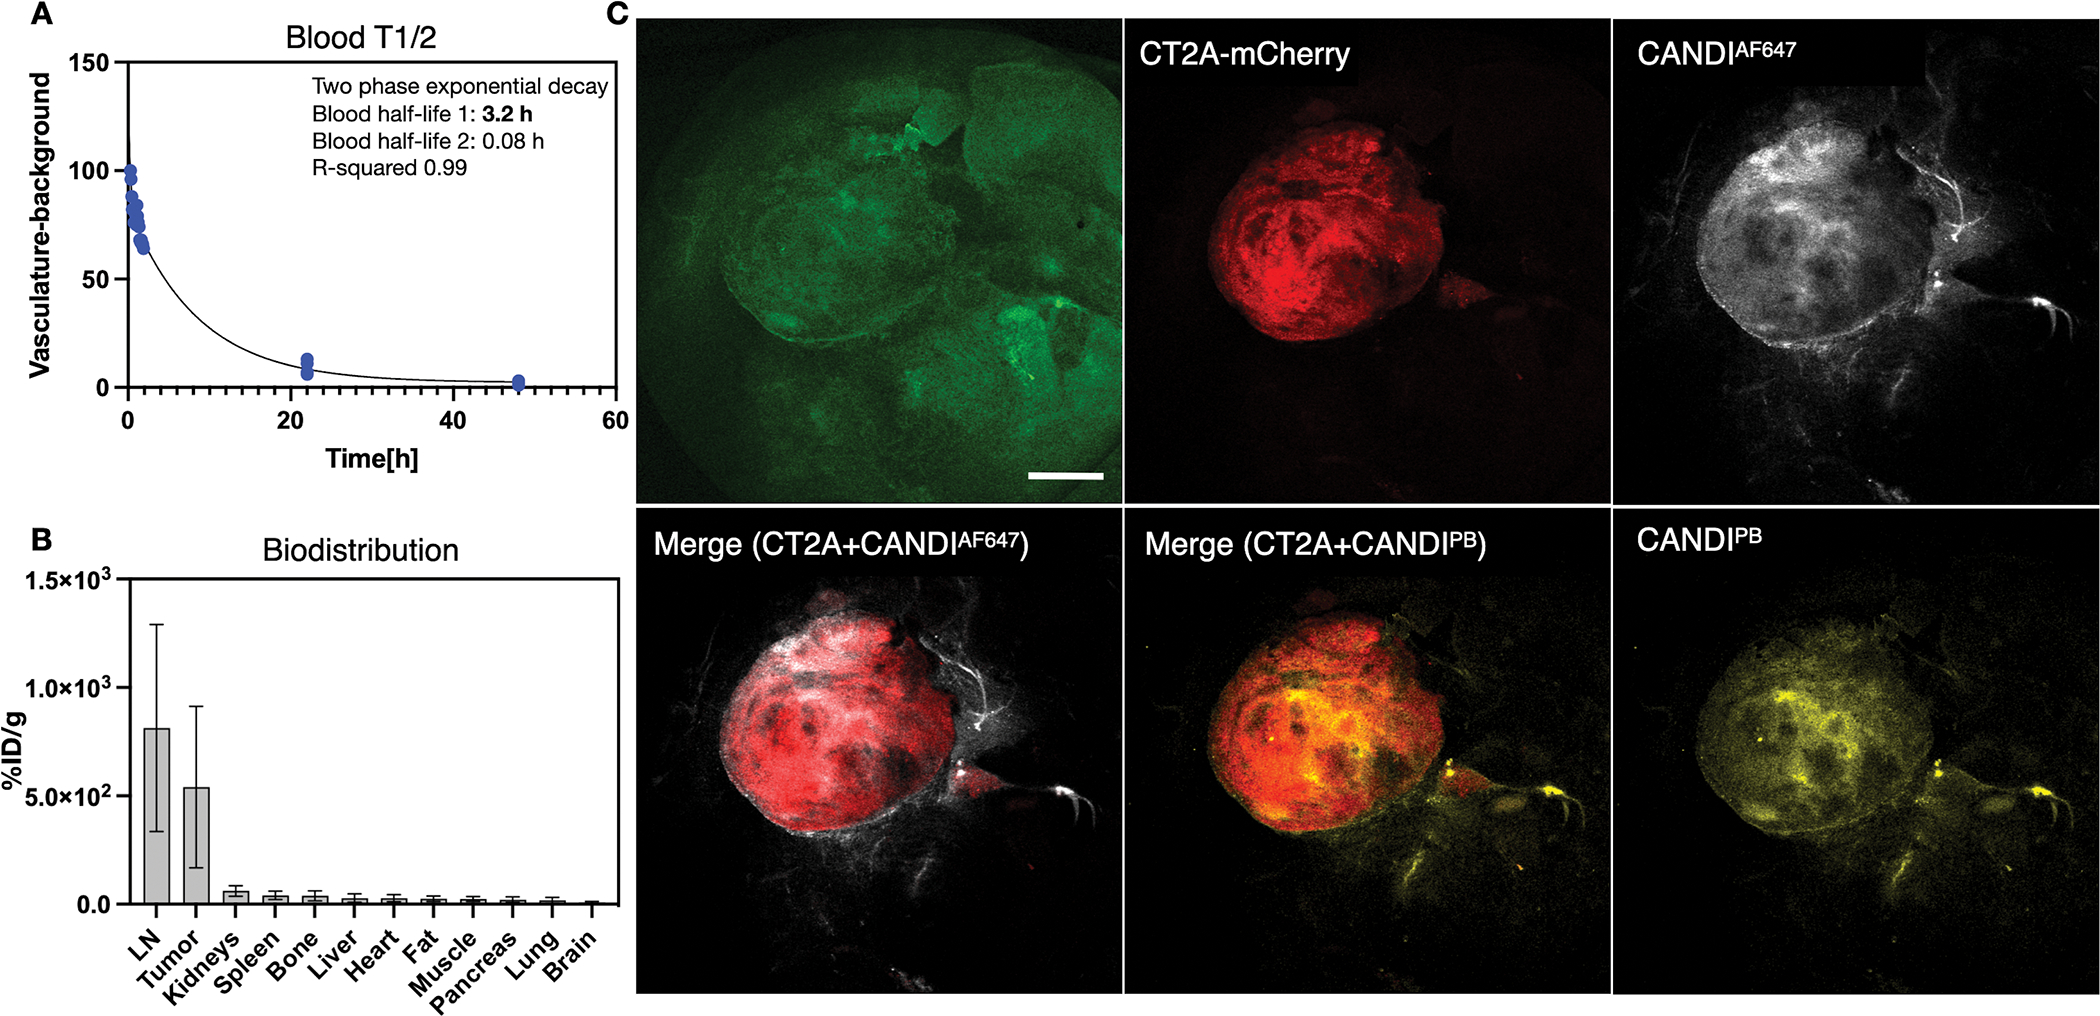
Fig. 4: Pharmacokinetics of CANDI in GBM-bearing mice.

A. Blood half-life (T1/2) determination showed a biphasic decay with a fast component of 5 minutes and a slow component of 3.2 hours (R2 = 0.99). B. The tissues with the highest accumulation of CANDI were GBM and lymph nodes. Note the logarithmic y-axis to show the display of lower tissue concentrations in other organs. Note that GBM/brain ratio is roughly 68:1, presumably because the malignancy alters the blood-brain-barrier and nanoparticles are small enough to efficiently accumulate in phagocytic cells. At the cellular level, the high uptake in GBM (> 500%ID/g tissue) and LN is due to the uptake of CANDI into macrophages and dendritic cells (see Figs. 6–8 for confirmation and quantitation C. Low magnification fluorescence images of resected brains (green autofluorescence) containing CT2A-mCherry tumors (red) and CANDIAF647 (white) or CANDIPB (yellow; scale bar = 1 mm). The left merge image represents the combination of CT2A-mCherry tumors (red) and CANDIAF647 (white). The right merge image represents the combination of CT2A-mCherry tumors (red) and CANDIPB (yellow). Note the high tumoral accumulation of CANDI (for additional example, see Fig. S9; N = 27 mice).
