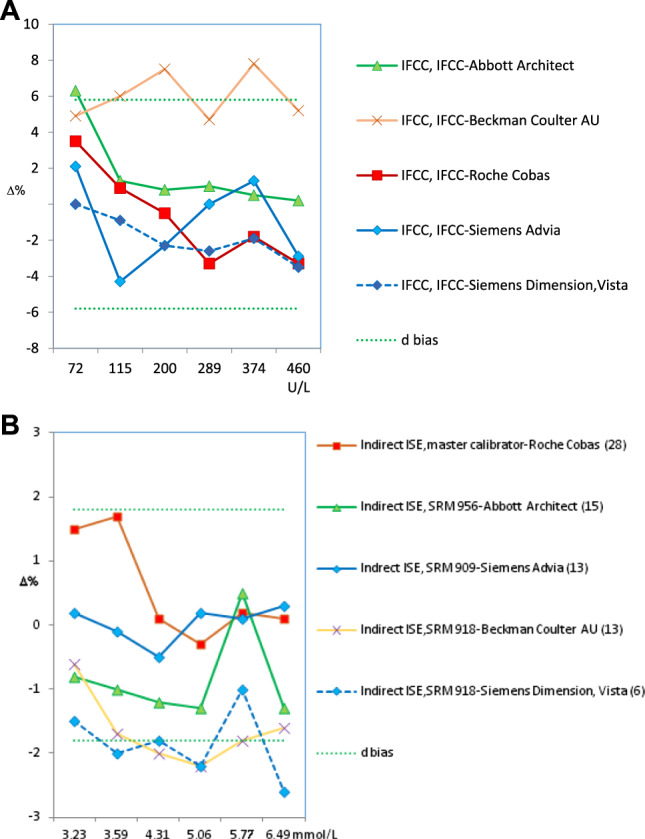
Figure 2:

Bias obtained for standardized analytes.
(A) CK (2018). (B) Potasium (2015–2018). Green dotted lines indicate the acceptable upper and lower bias based on BV. The bias shown may be the desirable (d) or the optimum (o). The number of participating laboratories in each comparison group is indicated in brackets.
