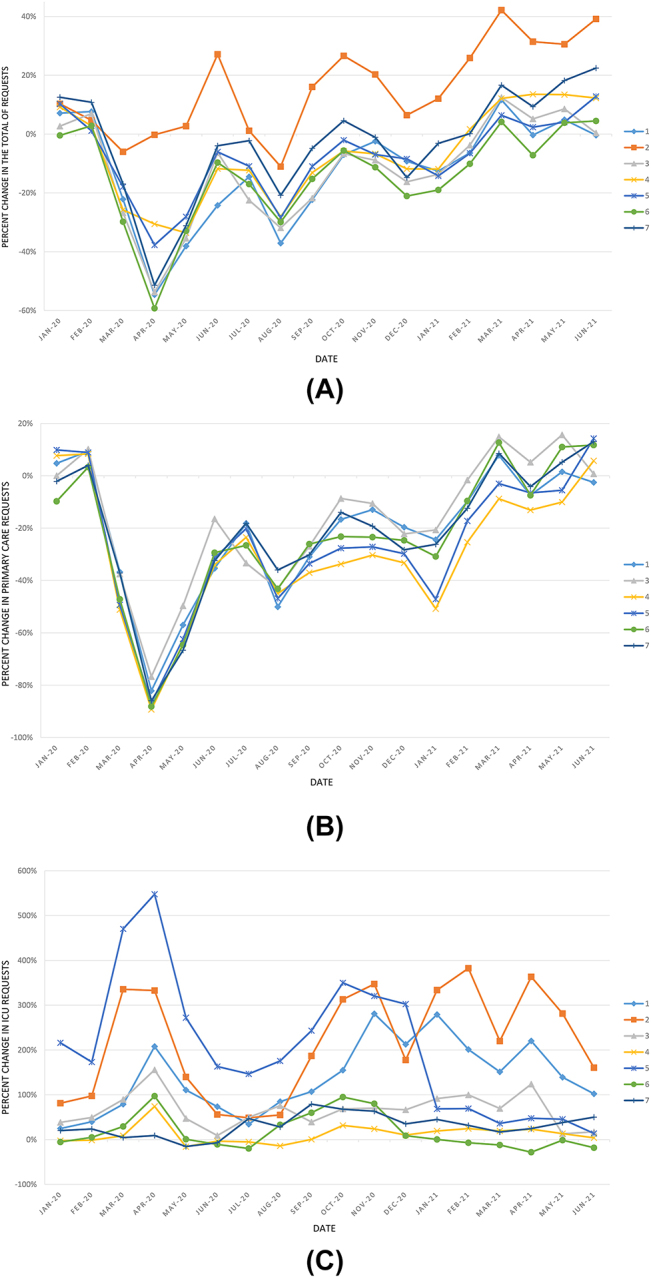
Figure 1:

Percent change in the number of requests received in each of the 7 laboratories, with respect to their corresponding average in 2019 during the study period: (A) total of requests; (B) number of requests from primary care (Laboratory 2 is excluded, since it does not serve this type of patients) and (C) number of requests from the ICU.
