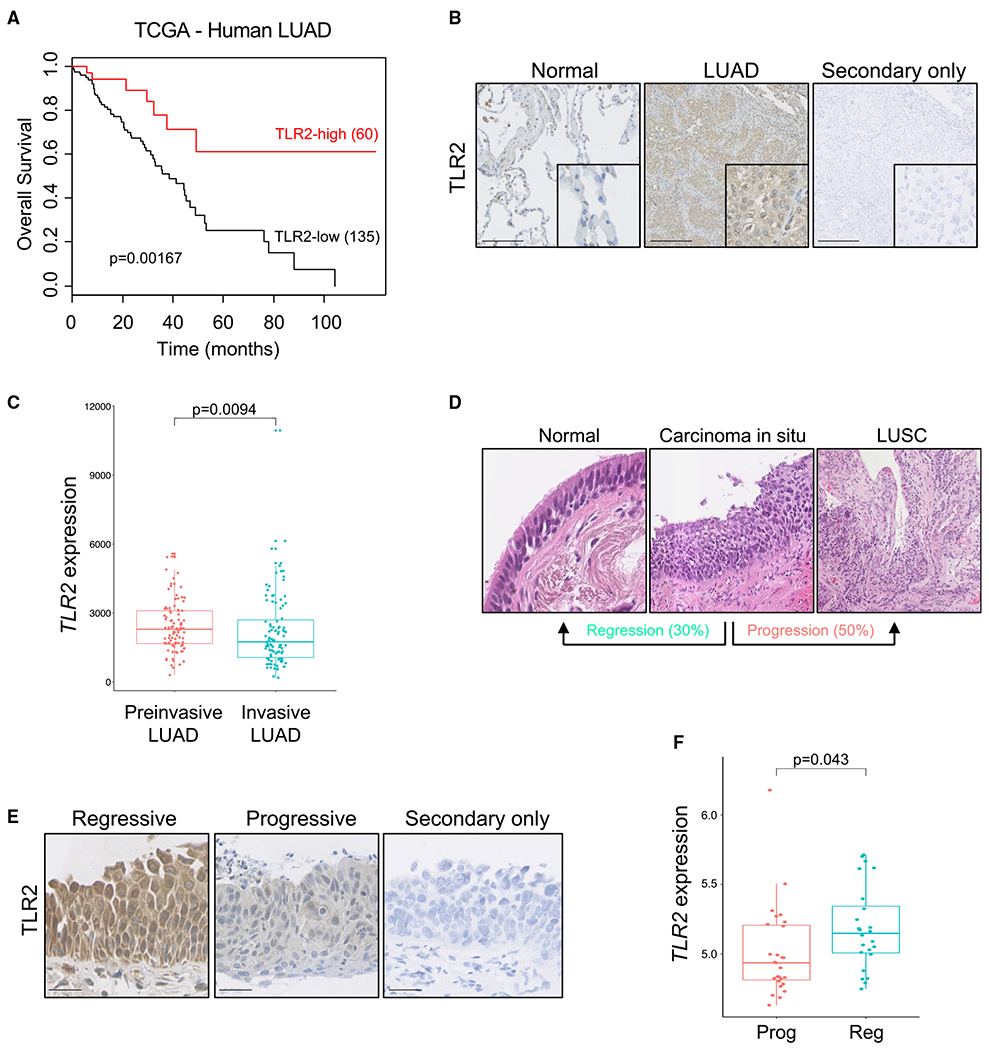
Figure 1. TLR2 expression correlates with improved survival and clinical regression in human lung cancer.

(A) Kaplan-Meier survival analysis of patients with LUAD based on high versus low TLR2 expression from the Cancer Genome Atlas (TCGA). Statistical analysis was performed using log rank (Mantel-Cox) test.
(B) Representative IHC staining for TLR2 in paired normal tissue and LUAD samples, with secondary only control. Scale bars, 250 μm.
(C) TLR2 gene expression was compared between preinvasive LUAD lesions (AIS and MIA) and invasive LUAD lesions. Data presented as median +/− interquartile range (IQR). Statistical analysis was performed using the Mann-Whitney test.
(D) Hematoxylin and eosin (H&E) images of preinvasive LUSC lesions, demonstrating that not all progress to invasive cancer; up to 30% regress to normal epithelium.
(E) Representative IHC staining for TLR2 in preinvasive LUSC lesions that progressed to cancer or regressed to normal epithelium, with secondary only control. Scale bars, 25 μm.
(F) TLR2 gene expression was compared between preinvasive LUSC lesions of equal grade that subsequently progressed to cancer (progressive [Prog]) or regressed to normal epithelium (regressive [Reg]). Data presented as median +/− IQR. Statistical analysis was performed using a linear mixed effects model to account for multiple samples from the same patient.
