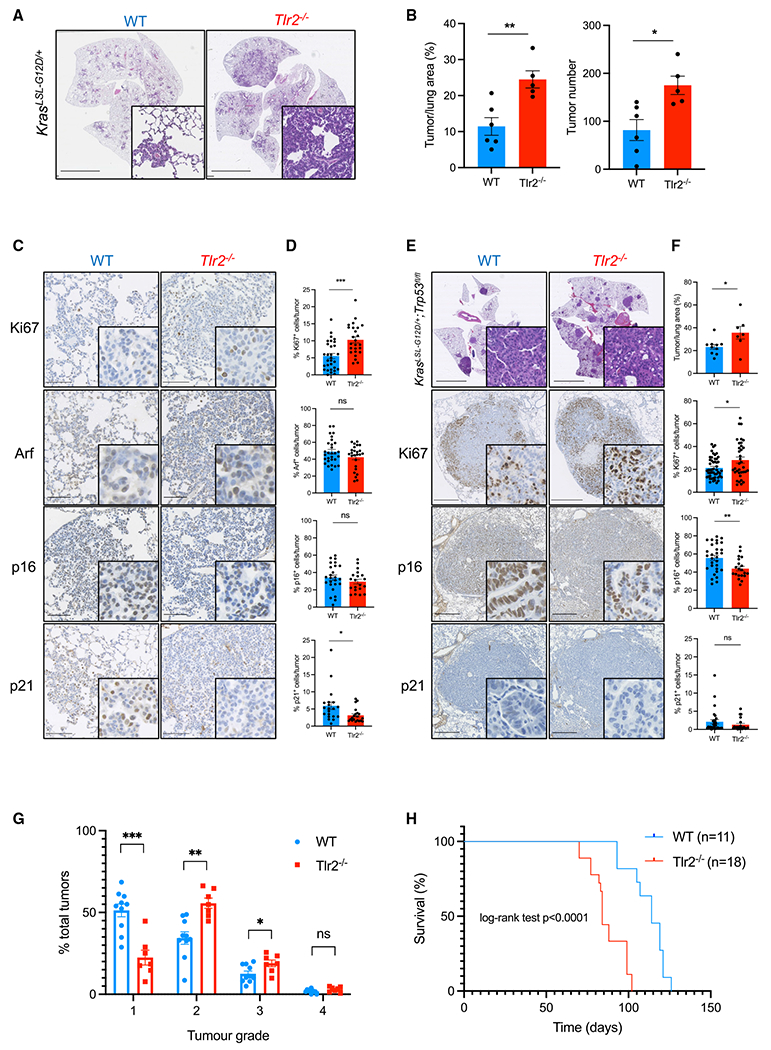
Figure 2. Tlr2 has a tumor suppressor function in murine models of lung cancer.

(A) Representative H&E images from KrasLSL-G12D/+ mice on a wild-type (WT) or Tlr2-null (Tlr2−/−) background 12 weeks after intranasal inoculation with AdenoCre. Scale bars, 5 mm.
(B) Quantification of tumor number and tumor burden (tumor area/total lung area × 100) from mice described in (A). n = 5–6 mice per group. Data presented as mean +/− standard error of the mean (SEM). Statistical analysis was performed using Student’s t test. *p < 0.05, **p < 0.01.
(C and D) Representative IHC staining of lung tumors from WT or Tlr2−/− mice for Ki67, Arf, p16, and p21 (C) with corresponding quantification (D). n = 5–6 mice per group (five tumors per mouse analyzed). Data presented as mean +/− SEM. Statistical analysis was performed using Student’s t test. ns, non-significant; *p < 0.05, ***p < 0.001. Scale bars, 100 μm.
(E and F) Representative H&E and IHC staining for Ki67, p16, and p21 of lung tumors from KrasLSL-G12D/+;Trp53fl/fl (KP) mice on a WT or Tlr2−/− background (E) with corresponding quantification (F). n = 7–10 mice per group (five tumors per mouse analyzed). Data presented as mean +/− SEM. Statistical analysis was performed using Student’s t test. *p < 0.05, **p < 0.01. Scale bars, 5 mm for H&E images and 500 μm for IHC images.
(G) Histological grading (1–4) of tumors from WT or Tlr2−/− KP mice 12 weeks after intranasal inoculation with AdenoCre. n = 7–10 mice per group. Data presented as mean +/− SEM. Statistical analysis was performed using Student’s t test. *p < 0.05, **p < 0.01, ***p < 0.001.
(H) Kaplan-Meier curve showing survival analysis of WT or Tlr2−/− KP mice after inoculation with AdenoCre. Statistical analysis was performed using log rank (Mantel-Cox) test.
