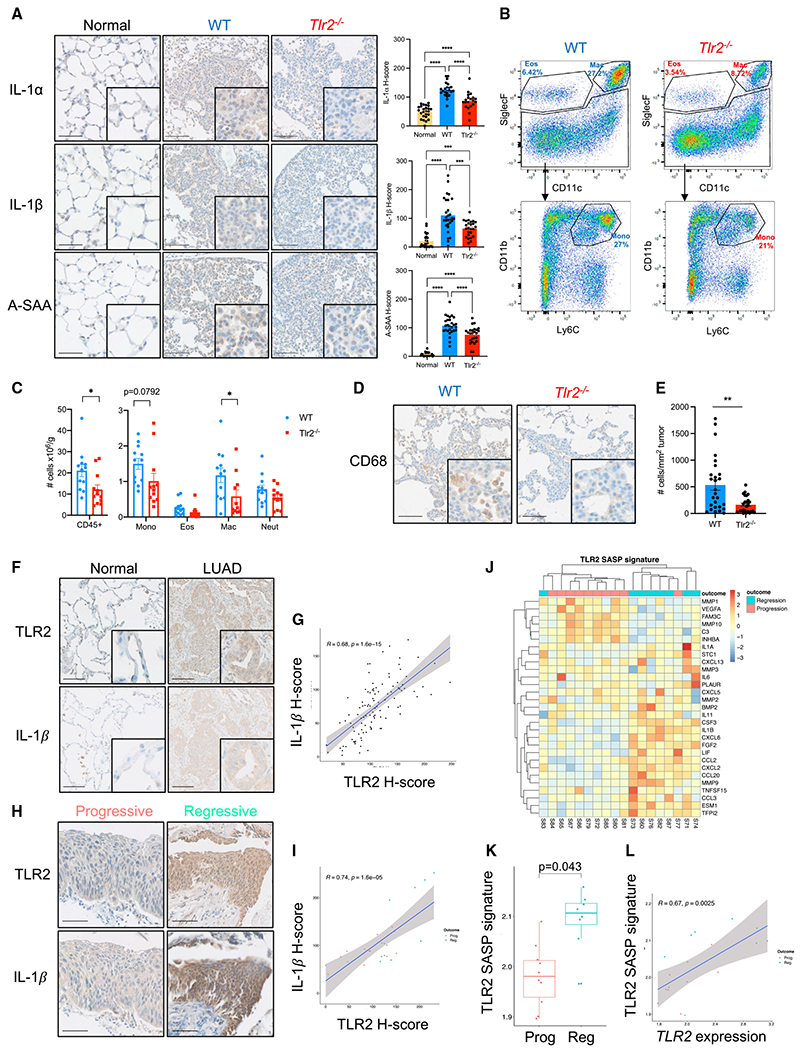
Figure 3. Tlr2 loss impairs expression of the senescence-associated secretory phenotype (SASP) in lung tumors.

(A) Representative IHC staining of normal alveolar tissue (normal) and lung tumors from KrasLSL-G12D/+ mice on a WT or Tlr2−/− background for the SASP factors interleukin-1-alpha (IL-1α), interleukin-1-beta (IL-1β), and serum amyloid A (SAA), with corresponding quantification. n = 5–6 mice per group (five tumors/areas per mouse analyzed). Data presented as mean +/− SEM. Statistical analysis was performed using a one-way ANOVA with post hoc Tukey tests for multiple comparisons. ***p < 0.001, ****p < 0.0001. Scale bars, 100 μm.
(B) Representative flow cytometry analysis plots of myeloid populations from whole-lung single-cell suspensions from tumor-bearing WT or Tlr2−/− mice. Percentage denotes the percentage of the parent population.
(C) Corresponding quantification of total immune cells (CD45+) and myeloid cells from WT (blue) and Tlr2−/− (red) mice. Mono, monocyte; Eos, eosinophils; Mac, macrophage; Neut, neutrophils. n = 12 mice per group. Data presented as mean +/− SEM. Statistical analysis was performed using Student’s t test. *p < 0.05.
(D and E) Representative IHC staining for the monocyte/macrophage marker CD68 in lung tumors from WT or Tlr2−/− mice (D) with corresponding quantification (E). Data presented as mean +/− SEM. Statistical analysis was performed using Student’s t test. **p < 0.01. Scale bars, 100 μm.
(F) Representative IHC staining for TLR2 and IL1β in consecutive sections of LUAD and paired normal tissue. Scale bars, 100 μm.
(G) Scatterplot with Pearson correlation analysis of IHC H-score analysis performed on serial sections for TLR2 and IL-1β.
(H) Representative IHC staining for TLR2 and IL-1β in preinvasive LUSC lesions that progressed to cancer or regressed to normal epithelium. Scale bar, 25 μm.
(I) Scatterplot with Pearson correlation analysis from IHC H-score analysis performed on serial sections for TLR2 and IL-1β on preinvasive LUSC lesions that progressed to cancer or regressed to normal epithelium.
(J) Heatmap demonstrating TLR2-SASP gene expression with clear clustering of progressive and regressive lesions.
(K) The TLR2-SASP signature was compared between lesions of equal grade that subsequently progressed to cancer or regressed to normal epithelium. Data presented as median +/− IQR. Statistical analysis was performed using a linear mixed-effects model to account for samples from the same patient.
(L) Scatterplot with Pearson correlation analysis comparing gene expression of TLR2 and the TLR2-SASP signature in Prog and Reg lesions.
